
Satellite Monitoring System in Myanmar Mangroves
Background
The extension of mangroves for the years 2016 and 2021 has been mapped for all the regions in the country with mangrove presence, as well as the changes between both years.
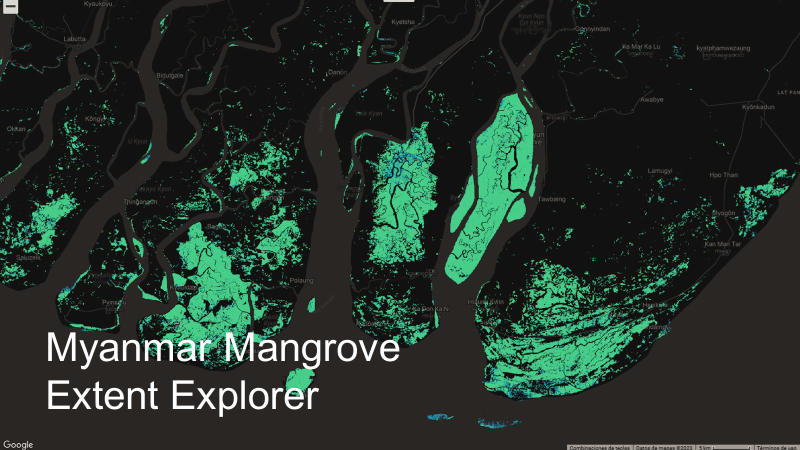
Data can be visualised and accessed in the Myanmar Mangrove Extent Explorer. In two of the regions with major mangrove forests, biomass and carbon content have been estimated from the National Forest Inventory. These data could support the development of a sub-national scale REDD+ programmes and corresponding Forest Reference Levels for Mangrove Forest.
1. Spatial data mapping overview
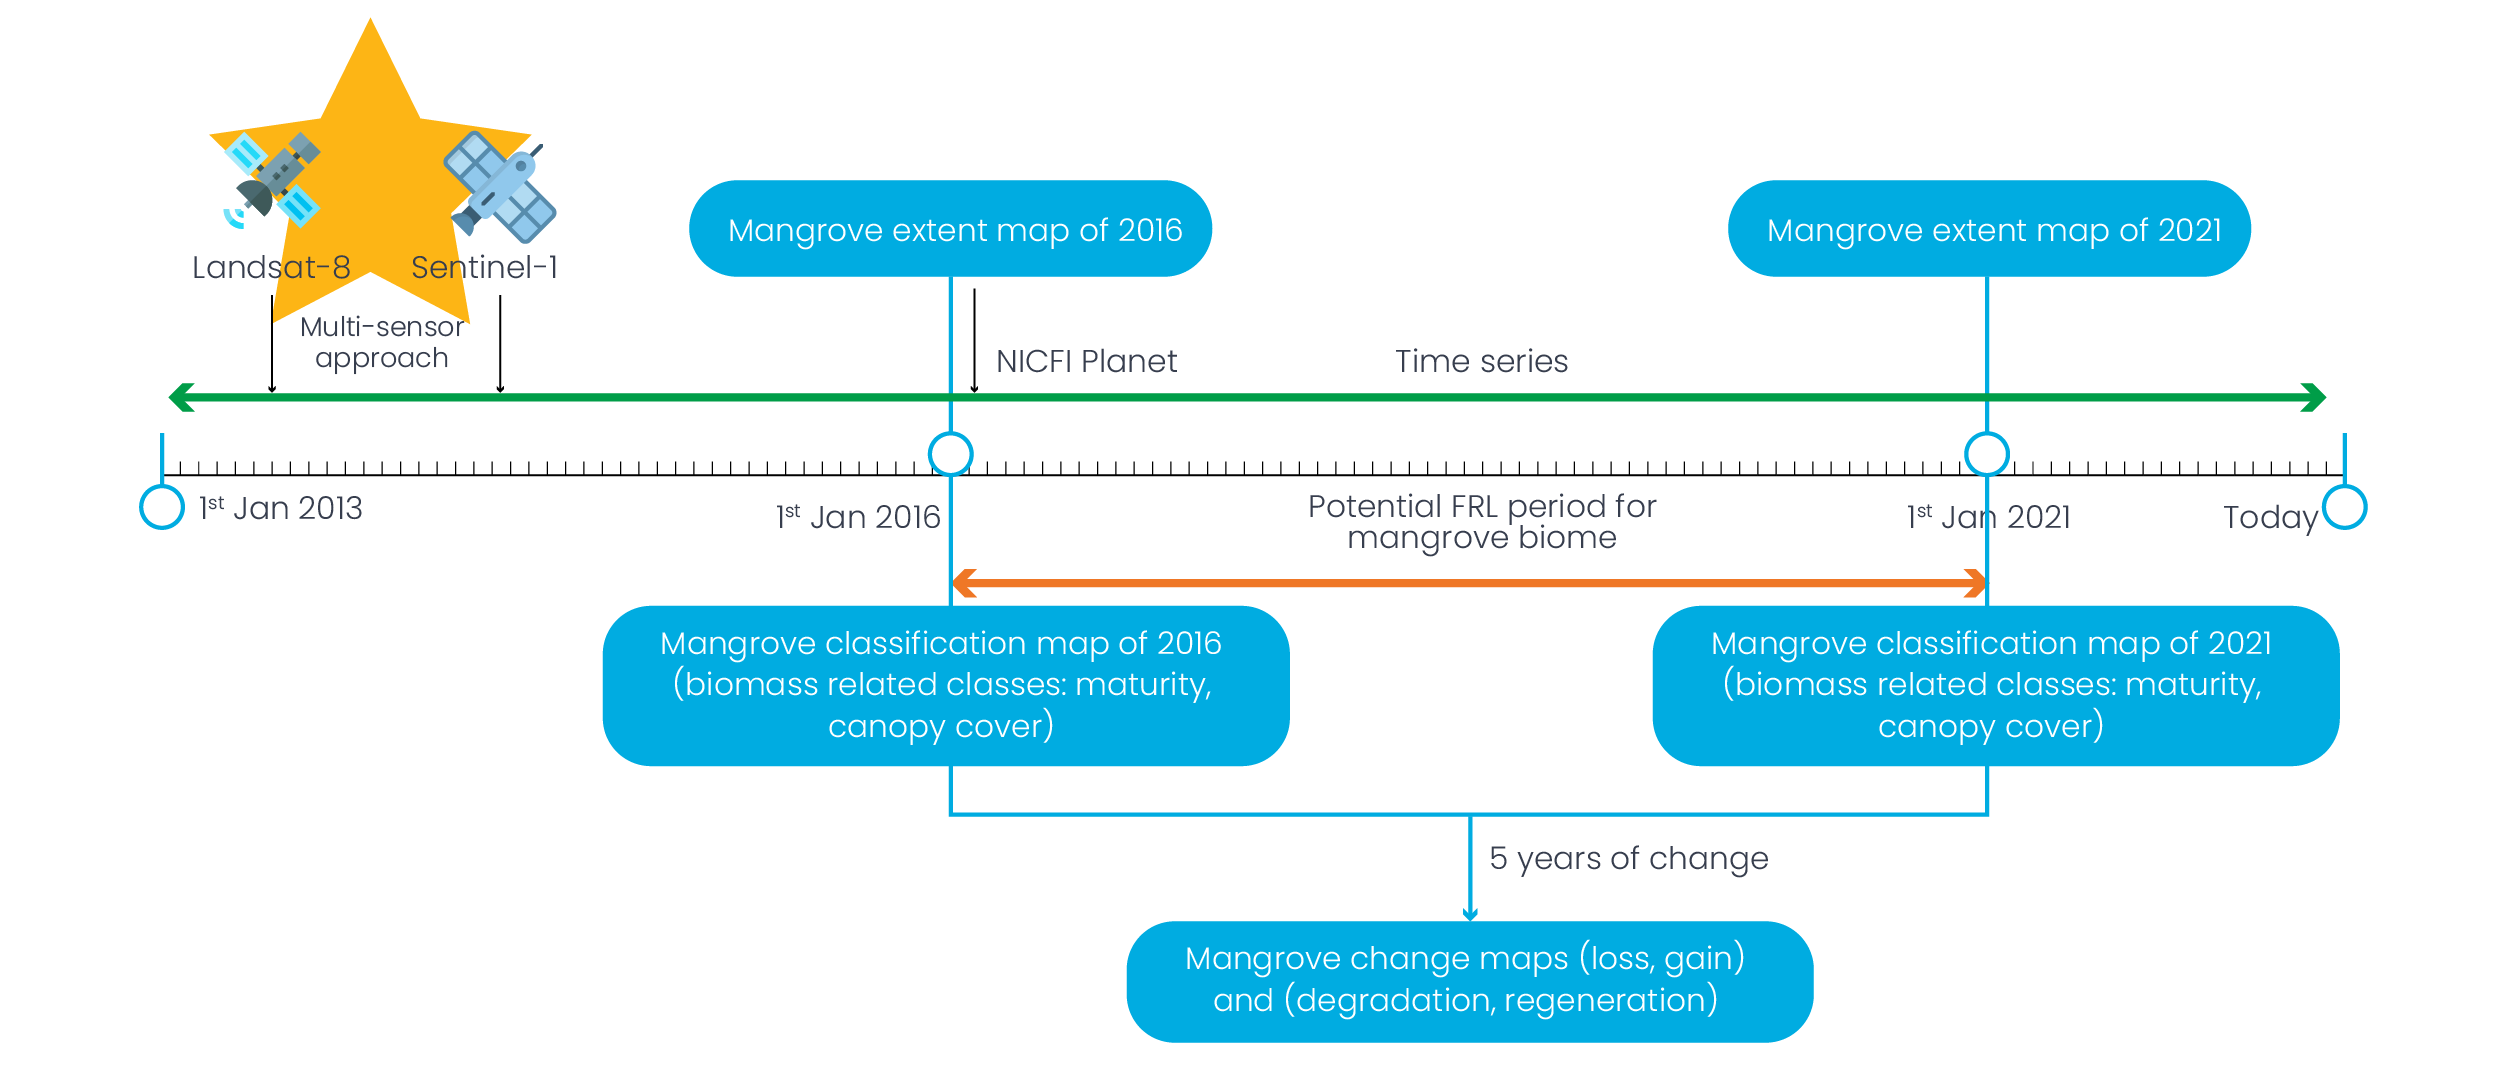
Mangrove extension maps for the 1st of January of the years 2016 and 2021, and mangrove change maps between both dates, have been created for the full country. For this, Global and national datasets, time series analysis of optical Landsat-8 and radar Sentinel-1 data (since 2013 and 2014 respectively) and Planet imagery available since 2016 through the NICFI program were used. The change study period could be considered as the reference for a potential Forest Reference Level (FRL) a sub-national level for the mangrove biome, consistent with the national scale FRL of Myanmar for 2015-2020.
2. Methodology
Time series of Landsat-8 and Sentinel-1 and the MERIT Digital Elevation Model were analysed with the Continuous Change Detection and Classification (CCDC) algorithm (Zhu and Woodcock 2014) to map probability of mangrove presence on the 1st of January of the years 2016 and 2021. CCDC modelling considers seasonality and interannual trends and identifies land cover changes as persistent anomalies (Figure 1). Available global and national datasets were used as training data source to classify the maps in mangrove and non-mangrove using a stratified random sampling and a supervised classification approach based on Random Forest. These datasets included the Global Mangrove Watch of 2016 (Bunting et al. 2018), the Global Distribution of Mangroves of 2000 (Giri et al. 2010), the Global Mangrove Distribution, Aboveground Biomass and Canopy Height of 2000 (Simard et al. 2019) and the Land Use Land Cover (LULC) map of Myanmar 2015 (MoNREC and FAO 2016). A combination of vegetation indices used in mangrove mapping studies, including NDVI, EVI, NDMI and NDWI (e.g., Chen et al. 2017), suitable to differentiate tropical evergreen forest, mangroves, tidal inundations, or yearlong water bodies, were considered in the classification. Additional training data collection over ‘uncertain’ areas by national experts through visual interpretation of Very High spatial Resolution (VHR) imagery, including Planet (3-5 m) data (Figure 2), and time series of vegetation indices improved the classification maps for both years.
Figure 1. Example of CCDC time series model of NDVI for a particular pixel in SEPAL (above) and VHR images of consecutive dates of the corresponding pixel (central point of middle plot) reflecting the land cover changes in Google Earth.
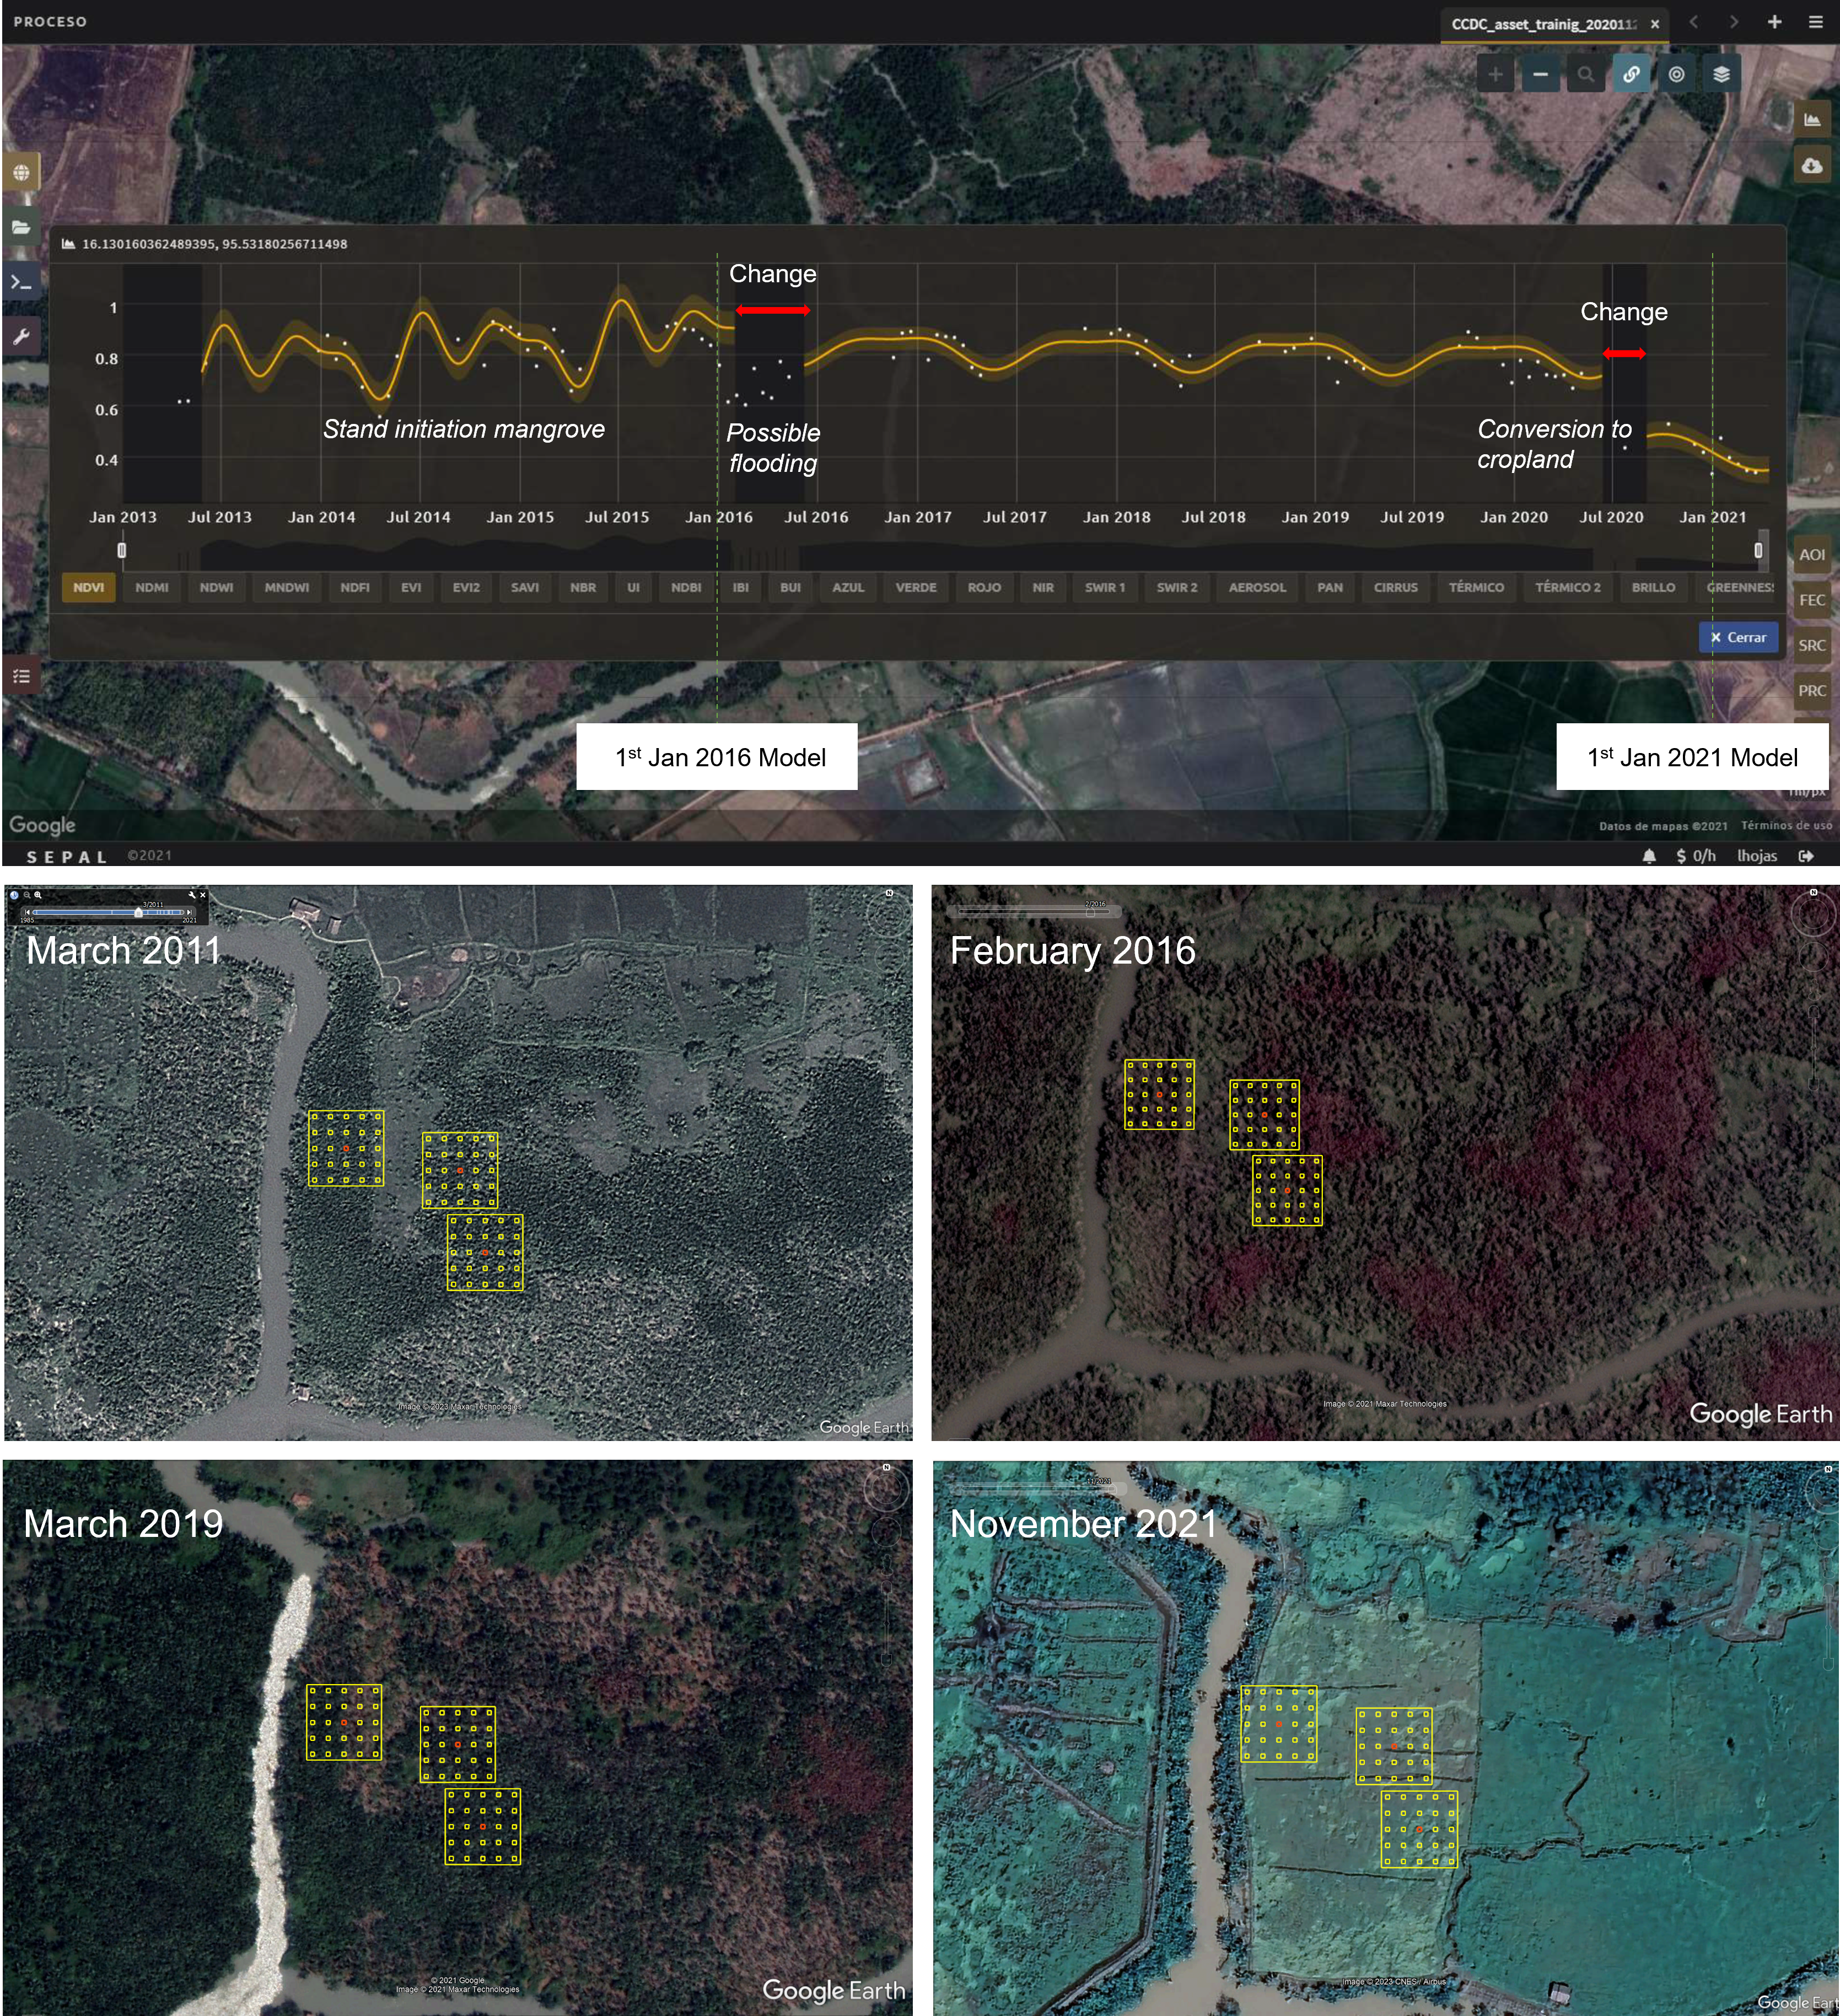
Figure 2. Example of Planet bi-annual mosaic Dec2015-May2016 and monthly mosaic Jan 2021 in Collect Earth showing land cover changes between both dates
3. Tools
All the software tools employed are free and open source, mostly part of the Open Foris toolkit:
SEPAL:
for modelling time series
Collect:
for sampling survey design
Collect Earth:
for sampling data collection.


Classification was done in Google Earth Engine and data management and analysis in RStudio.
Sample data collection in Collect Earth over an ‘uncertain’ area
4. Mangrove Extent and Changes
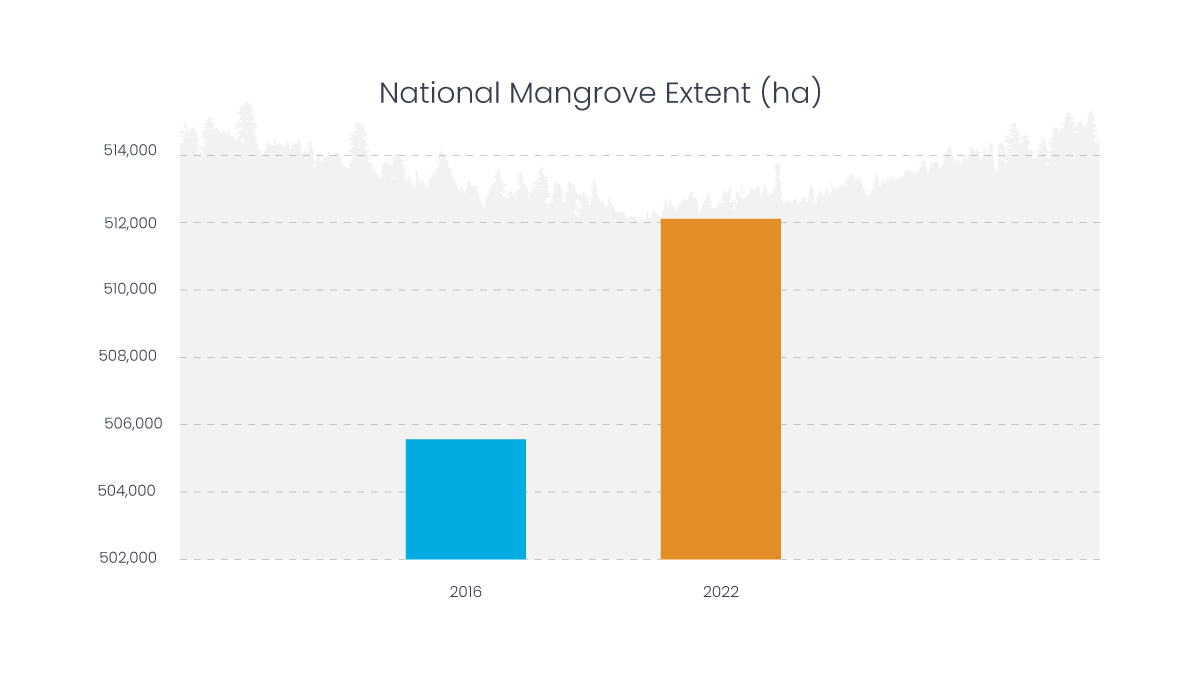
There is an overall increase in mangrove extension in Myanmar of almost 1.3% between the 1st of January of 2016 and the 1st of January of 2021 (5 years), which represents an annual net increase rate of almost 0.3% (Table 1).
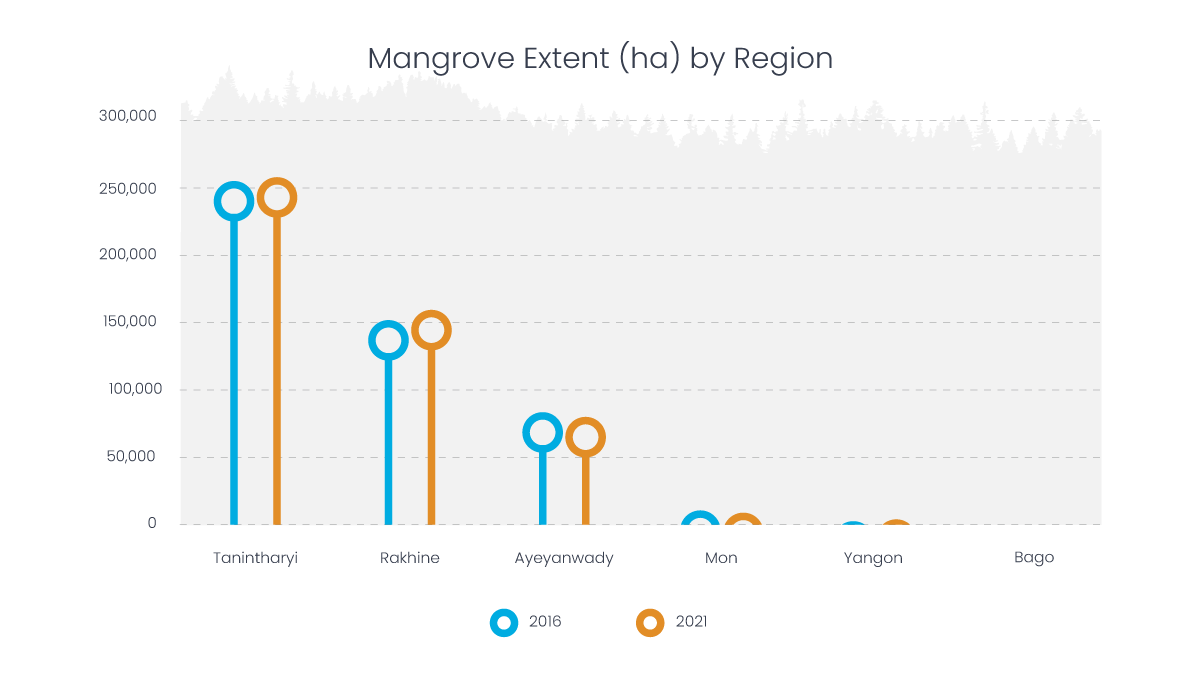
97% of the total mangrove area in the country is distributed between three regions: Tanintharyi, Rakhine and Ayeyarwady. Of these, Rakhine had the greatest increase, with an annual net increase rate of circa 1%, and Ayeyarwady the greatest loss, with an annual net loss of almost 1% (Table 1).
Table 1. Estimated mangrove extent of 2016 and 2021 and deforestation/regeneration rate by region and for the entire country.
|
Extent |
Deforestation / regeneration rate |
||
|---|---|---|---|
|
Region |
2016* (ha) |
2021* (ha) |
%/year |
|
Tanintharyi |
255.165 |
257.524 |
0.18 |
|
Rakhine |
151.116 |
159.379 |
1.09 |
|
Ayeyarwady |
84.069 |
80.059 |
-0.95 |
|
Mon |
11.219 |
9.463 |
-3.13 |
|
Yangon |
2.265 |
4.393 |
18.79 |
|
Bago |
1.690 |
1.284 |
-4.80 |
|
Country |
505.524 |
512.102 |
0.26 |
*On the 1st of January
Satellite images show that during this period, mangrove loss in Ayeyarwady has been mainly due to the conversion to rice paddies and clear cuts, in Rakhine the main cause of mangrove loss has been the conversion to croplands, mainly paddy rice, and in Tanintharyi the losses were driven by large-scale agribusiness concessions (oil palm and rubber plantations), aquaculture for shrimp farming and coastal changes.
The mangrove extent maps for 2016 and 2021 and the mangrove change map 2016-2021 can be visualized in the Myanmar Mangrove Extent Explorer, as well as some example locations with changes .
5. Comparison with Other Maps
There are no other existing mangrove extent maps of Myanmar for recent years. Therefore, the mangrove extent map of 2016 was compared to other global and national products of the years 2000 and 2016 (Table 2).
Table 2. Estimated mangrove extent of 2016 in comparison to other global and national datasets
| Ayeyarwady (ha) |
Tanintharyi (ha) * |
Rakhine (ha)* |
Mon (ha)* |
Yangon (ha)* | Bago East (ha)* | Country | |
|
Global Mangrove Watch, 2016(Bunting et al. 2018) |
115.216 | 232.285 | 137.404 | 3.670 | 440 | 0 | 489.015 |
|
Global Mangrove Forest Distribution, 2000 (Giri et al. 2013) |
117.547 |
235.260 |
134.147 |
8.209 |
588 |
0 |
495.751 |
|
Global Mangrove Distribution, Canopy Height, Biomass, 2000 (Simard et al. 2019) |
117.059 |
228.823 |
109.128 |
7.656 |
527 |
0 |
463.193 |
|
Land Use Land Cover (LULC), 2015 (MONREC and FAO 2016) |
78.802 |
256.894 |
125.368 |
3.834 |
3.906 |
1.139 |
469.943 |
|
Mangrove extent map 2016 (FAO 2023) |
84.069 |
255.165 |
151.116 |
11.219 |
2.265 |
1.690 |
505.524 |
These datasets differ in mangrove area and distribution among them. For example, in Ayeyarwady the mangrove area of the national LULC map (MONREC and FAO 2016) is around 30% less than that of the global maps (Bunting et al. 2018, Giri et al. 2013 and Simard et al. 2019), while in Tanintharyi is 10% greater.
All the maps in Table 2 can also be visualized in the Myanmar Mangrove Extent Explorer.
6. Achievements
|
|
Creation of updated maps for mangrove forest at country level, with results aligned with the national LULC map of 2015. |
|
|
Creation of mangrove forest change maps that can serve for the estimation of the activity data of a potential FRL for the mangrove biome. |
|
|
Development of a methodology that is:
|
|
|
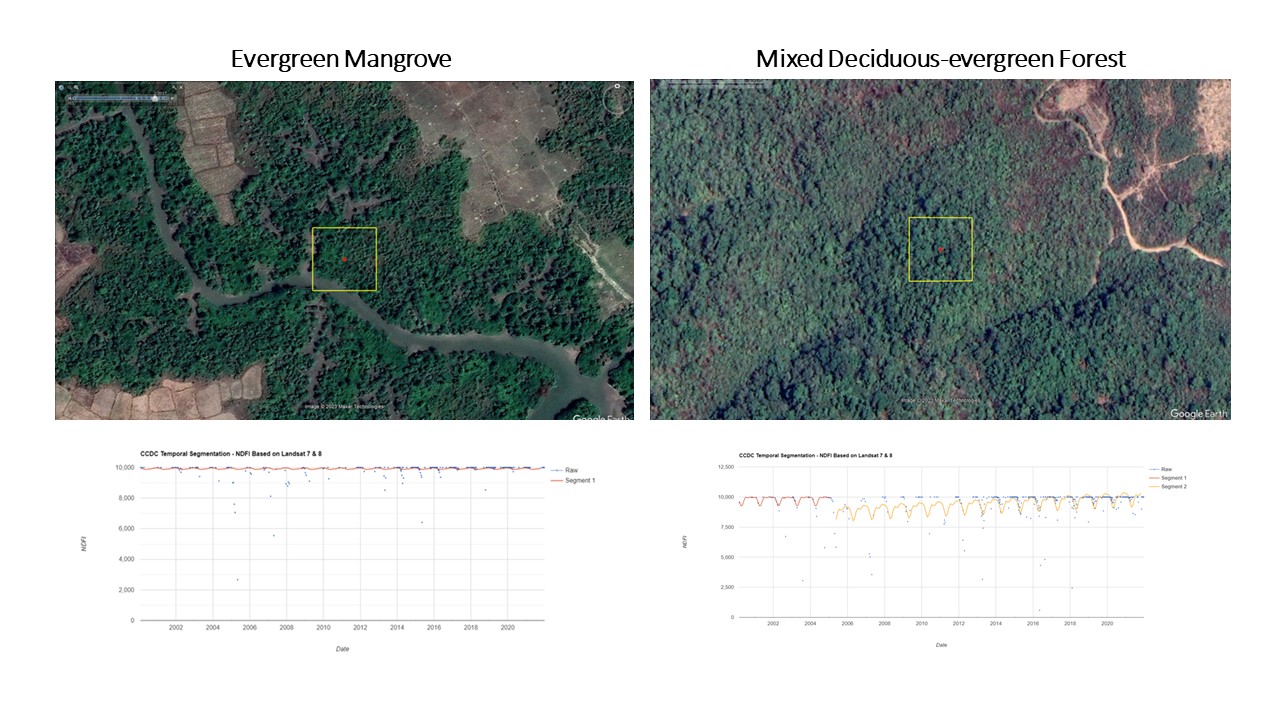
Creation of a sampling collection survey suited for mangroves mapping that facilitates both change detection and classification (e.g., discrimination of mangrove vs. hardwood evergreen/mixed deciduous forest or mature mangrove vs. young mangrove) |
Figure 2. Example of CCDC model of the vegetation index NDFI for a mangrove forest vs. tropical mixed evergreen deciduous forest (with higher seasonal fluctuation)
7. Limitations
The national and global products used as the initial training dataset source come from satellite imagery of different dates (2016 and 2000). Therefore, the subsequent sampling data collection over ‘uncertain’ areas by visual interpretation was a key step in ‘shaping’ results.
8. Data explorer
The Myanmar Mangrove Extent Explorer is a web application developed to make the mangrove maps and results easy to explore and query. It allows users to visualize the mangrove extent maps for the years 2016 and 2021 and the mangrove change map for the period 2016-2021, with different base maps and satellite imagery of high spatial resolution, compare them with other existing maps, and display the mangrove extent results at national level or for a selected region. Data can be downloaded in raster (.tif) format.
Visit the Myanmar Mangrove Extent Explorer.
9. Training
As part of the Webinar Series ‘Mapping trends and impacts for people and nature in Myanmar’s mangroves’ happening from March – April 2023:
Webinar Session 1 (part2) on Mapping mangroves in Myanmar
|
‘Mapping mangrove extent and mangrove changes for Ayeyarwady and Tanintharyi regions - Use of time series analysis with the CCDC algorithm in SEPAL and sampling data collection in Collect Earth’.
|
Download Document |
| ‘Classifying mangroves and mangrove changes for Ayeyarwady and Tanintharyi regions - Use of time series analysis with the CCDC algorithm in SEPAL and data from the NFI’. | Download Document |
|
Training material:
|