
Investment Priorities for Social Forestry
Mapping Sustainable Growth in ASEAN
Empowering Climate Mitigation through Social Forestry Investment in ASEAN Nations
As Southeast Asia grapples with increasing vulnerability to climate change, member states within ASEAN are at the forefront of efforts to mitigate its impacts while promoting sustainable development. However, despite the active engagement in global initiatives such as the Paris Agreement, the effectiveness of social forestry programs remains under scrutiny due to challenges in policy implementation and monitoring.
In this article, we will tackle how the ASEAN Social Forestry Initiative utilizes innovative spatial prioritization tools like se.plan, integrated with the SEPAL platform, to identify investment-worthy areas for social forestry while overcoming data limitations through predictive modeling techniques.
Objectives
The objective of this work is to identify areas in Cambodia, Lao PDR, and Indonesia where investment in forest commodity enterprises will (1) have a high socio-economic return on investment, (2) have the potential to be integrated into social forestry management, and governance structures, (3) have relatively high climate change mitigation and adaptation value, and (4) support the restoration of tree cover. This intersection of economic benefits and forest-positive outcomes is illustrated in Figure 1 below.
Figure 1
Methods
1. SF Modeling:
Utilizing machine learning to produce continuous spatial data layers representing the likelihood of a given location either already being under social forestry (SF) or being under SF in the future.
2. SE.PLAN:
Used for spatial prioritization considering economic viability, social forestry development potential, and environmental factors.
SF Modeling
In the SF modeling phase, extensive data compilation and machine learning techniques were employed to predict the likelihood of current and future social forestry occurrence. While comprehensive data on established social forestry areas were available for Cambodia, transfer learning approaches were adopted for Laos and Indonesia due to data limitations.
Table 1: Data layers used in mapping probability of social forestry.
| Dataset | Description | Source | |
| Dynamic Forest Fragmentation Index (FFI) | Global | Dynamic Forest Fragmentation Index (FFI) global This dataset represents the differences, from 2000 to 2020, in characteristics of forest fragmentation, including edge, isolation, and patch size effects. | |
| Forest-Proximate People (FPP) | Global | This dataset provides an estimate of the number of people living in or within 5 kilometers of forests for 2019. | |
| SRTM Landforms | Global | This dataset provides landform classes created by combining the Continuous Heat-Insulation Load Index (SRTM CHILI) and the multi-scale Topographic Position Index (SRTM mTPI) datasets for 2006 to 2011. | |
| Oxford Map Friction Surface | Global | This dataset contains land-based travel speed for all land pixels between 85 degrees north and 60 degrees south for the year 2019. It also includes "walking-only" travel speed, using non-motorized means of transportation. | |
| NASA SRTM Digital Elevation 30m | Global | This dataset provides global elevation data and was used to derive other topographic variables such as slope, aspect, eastness, and northness. | |
| ESA WorldCover 10m v200 | Global | This dataset provides 11 land cover classes as a global map for the year 2021 on Sentinel-1 and Sentinel-2 data. | |
| Land cover | Cambodia | This dataset provides 14 land cover classes as a map for the year 2020. It was derived from the Biophysical M&E Dashboard tool, being used by USAID/Cambodia to track performance and report on landscape-scale efforts and biophysical conditions on the ground in accordance with quantifying areas of biological improvement and improved natural resource management. |
Random forest models were used to predict the likelihood of social forestry establishment within each country, considering factors such as forest-proximate population, elevation, land cover, and landforms. The outcome of this modeling effort produced probability surfaces, offering valuable insights into areas suitable for social forestry initiatives across the target countries. (See Figures 2a and 2b-1 to 2b-3 for examples of probability surfaces generated from the modeling process.)
Figure 2a. Relative likelihood of social forestry management/governance arrangements in Laos PDR (upper left panel), Cambodia (upper right panel), and Indonesia (lower panel).
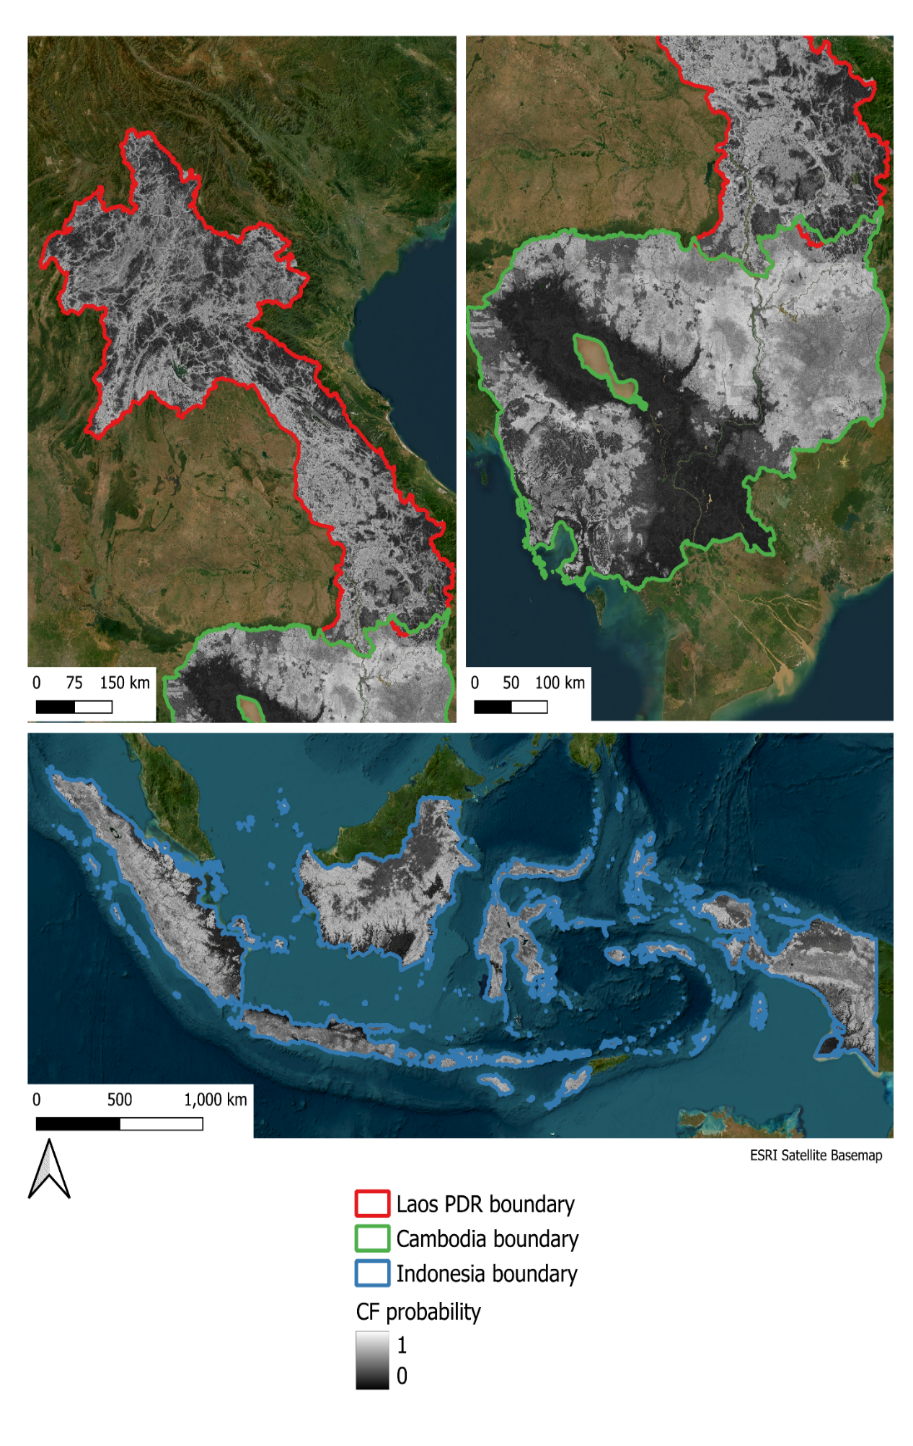
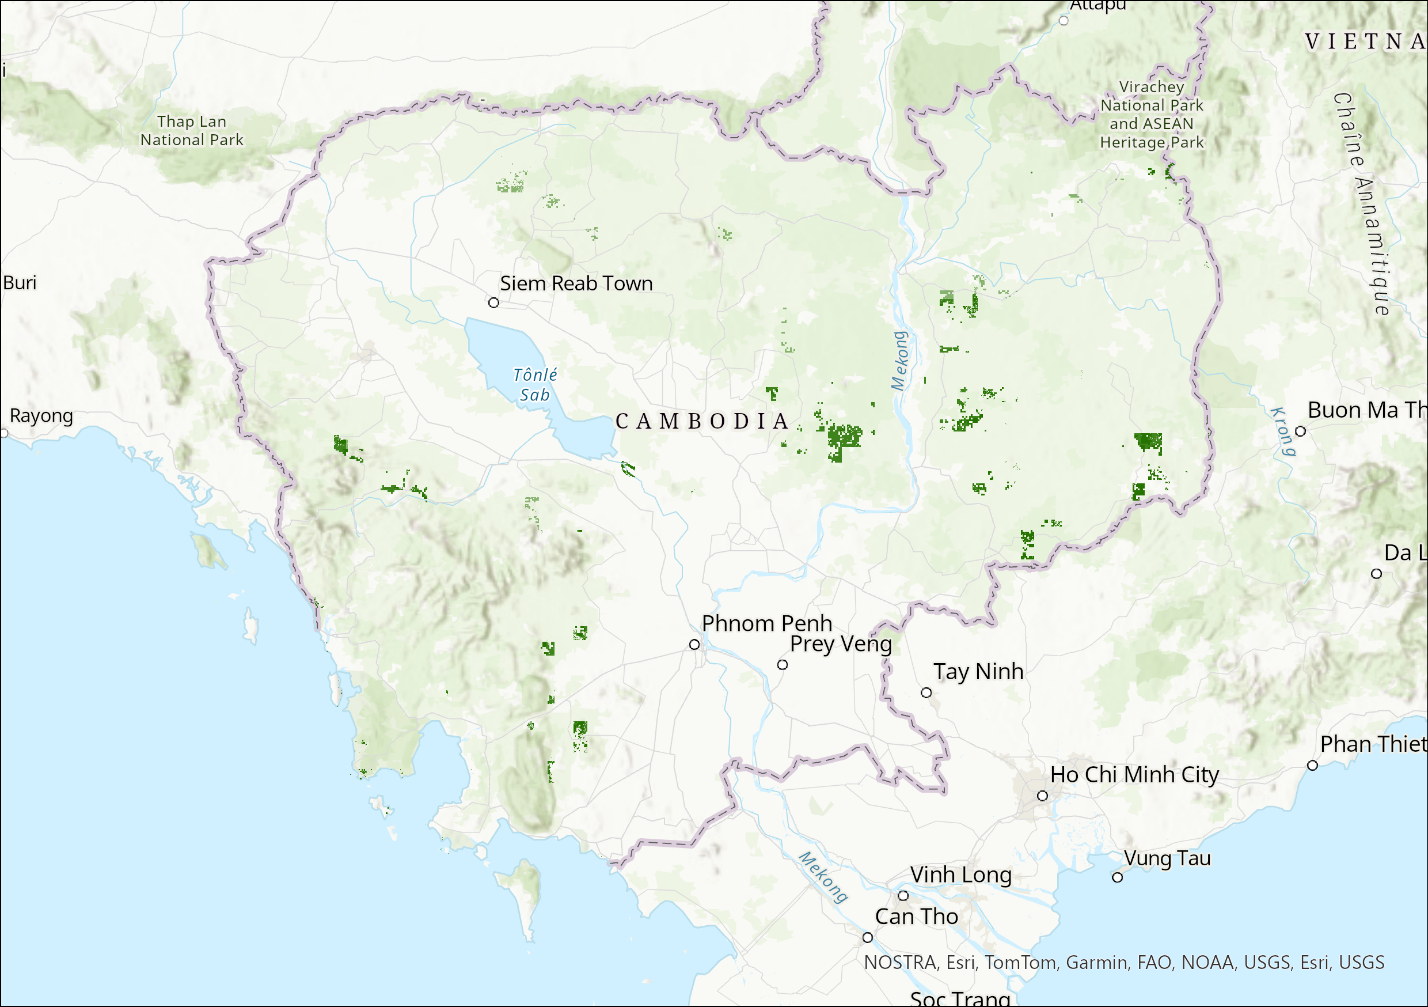
Figure 2b-1. Areas of higher relative likelihood (p > 0.5) of social forestry management/governance arrangements in Cambodia. Point locations in yellow are where environmental predictor variables were sampled for fitting the random forest model
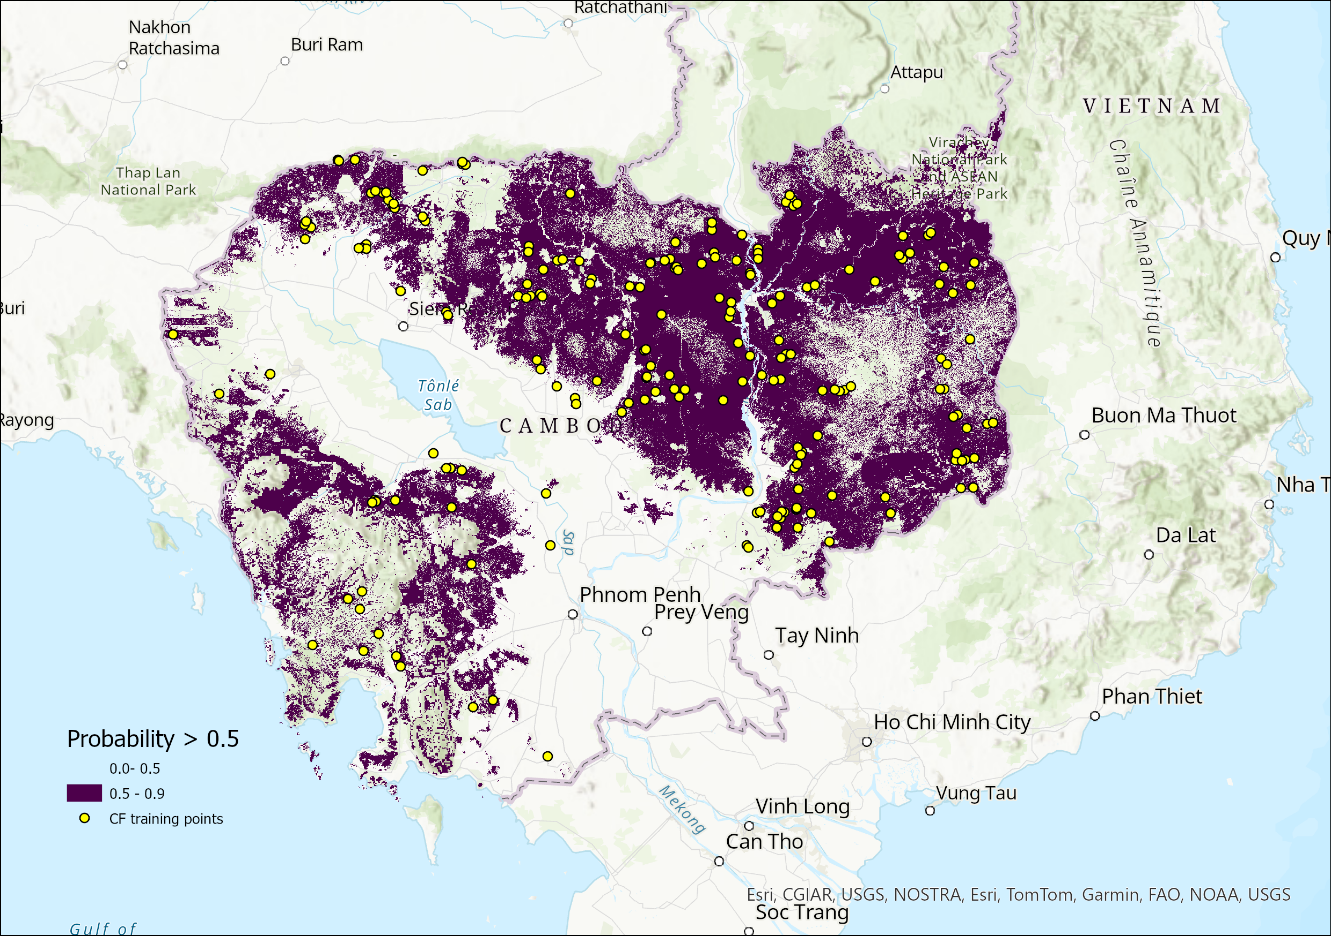
Figure 2b-2. Areas of higher relative likelihood (p > 0.5) of social forestry management/governance arrangements in Lao PDR.
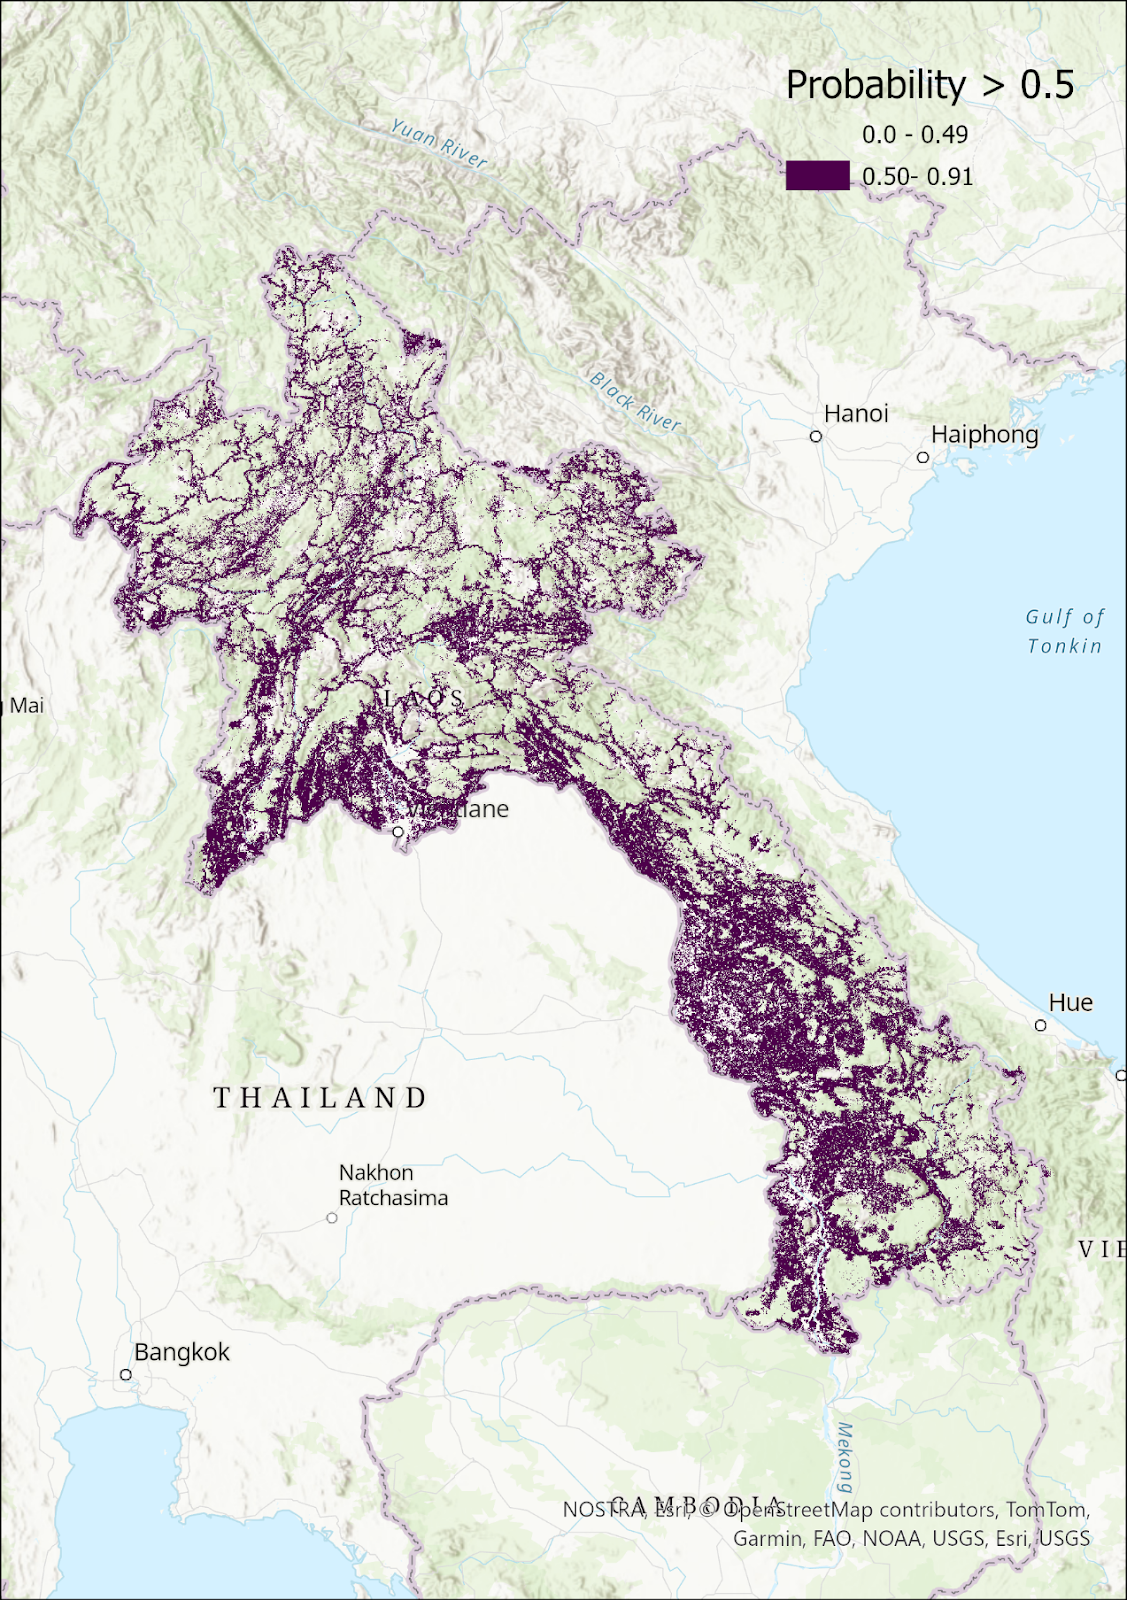
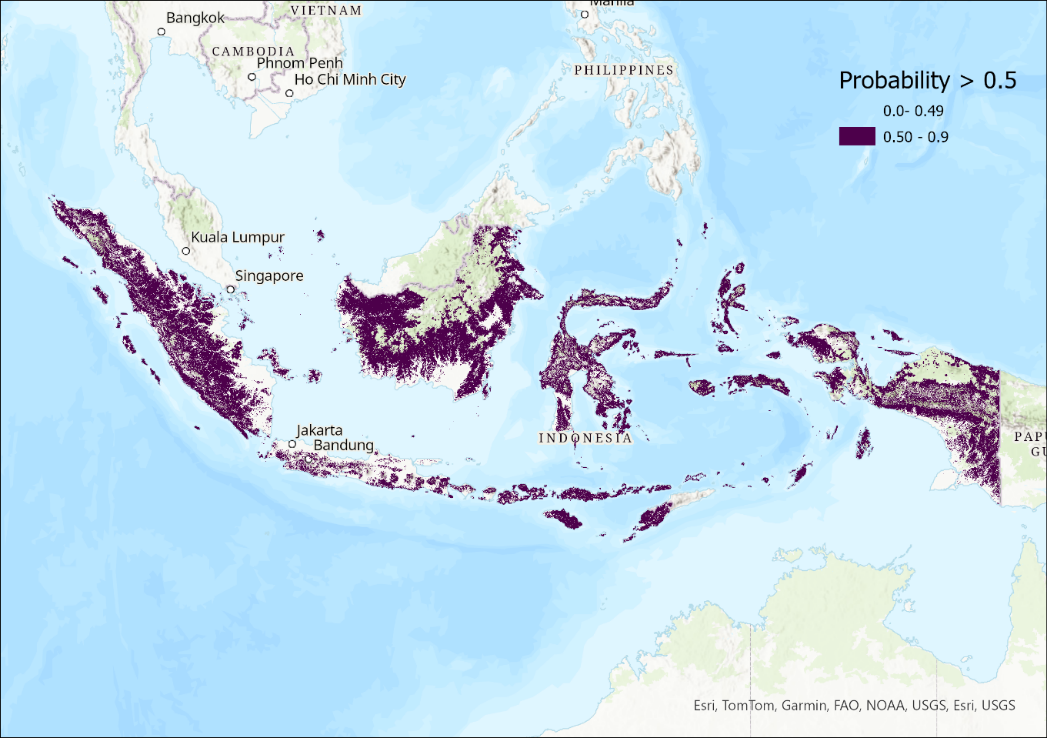
Figure 2b-3. Areas of higher relative likelihood
SE.PLAN Summary
The SE.PLAN tool aims to identify areas where the benefits of forest restoration outweigh the costs, considering biophysical and socioeconomic constraints. It combines cost and normalized benefit layers to compute a detailed cost-benefit ratio, resulting in a 0-5 priority score. Higher scores indicate more promising areas for investment in commodity species and associated value chains.
Our approach involved running SE.PLAN analyses for priority forest commodity species in Cambodia, Laos, and Indonesia, integrating national ecosystem and demographic contexts. Environmental constraints based on optimal environmental niches for each species were considered, ensuring consistency across scenarios. Notably, maximum weight was given to benefits associated with local livelihood enhancement and wood production (See Table 2 for environmental niche information).
Table 2. Environmental niche information for species analyzed.
| Species | Tectona grandis (Laos, Indonesia) | Cratoxylum formosum (Laos) | Paraserianthes falcataria (Indonesia) | Sindora siamensis (Sindora cochinchinensis) (Cambodia) | Vatica astrotricha (Cambodia) | Shorea obtusa (Cambodia) | Xylia xylocarpa (Xylia dolabriformus) (Cambodia) |
| Annual rainfall range (min and max) | 1,000-3,800 mm | 1000 to 3000 mm | 800 to 3,500 mm | 1,000 - 4,000 | 800 to 4,000 mm | 1,250 - 4,000 mm | 0- 1,500 m |
| Temperature range (min and max) | 20-40°C | 20°C to 35°C | 15-35°C | 15°C-35°C | 15°C-35°C | 20°C-35°C | 16 - 35°C |
| Altitude range (min and max) | 0-1500 m | 0-1500 m | 0-2,000 m | 0-1,500 m | 0 -1,500 m | 0- 1,500 m | 0-1,500 m |
| Slope | <20% | > 5% |
*Note that taxonomic synonyms are frequently used for two of the species above (Sindora siamensis and Xylia xylocarpa) so the synonyms are provided here for clarity to all readers.
A detailed description of the se.plan tool including standard datasets can be found at: https://docs.sepal.io/en/latest/modules/dwn/seplan.html.
SE.PLAN map results
CAMBODIA:
Influential factors in SE.PLAN outputs included maximum tree cover, designated protected areas, and elevation requirements, resulting in lower priority scores. Temperature and precipitation were not significant factors. Patterns observed in the results signify favorable regions for potential social forestry-related investment in Cambodia.
Figure 3a. se.plan map outputs for focal commodity species in Cambodia
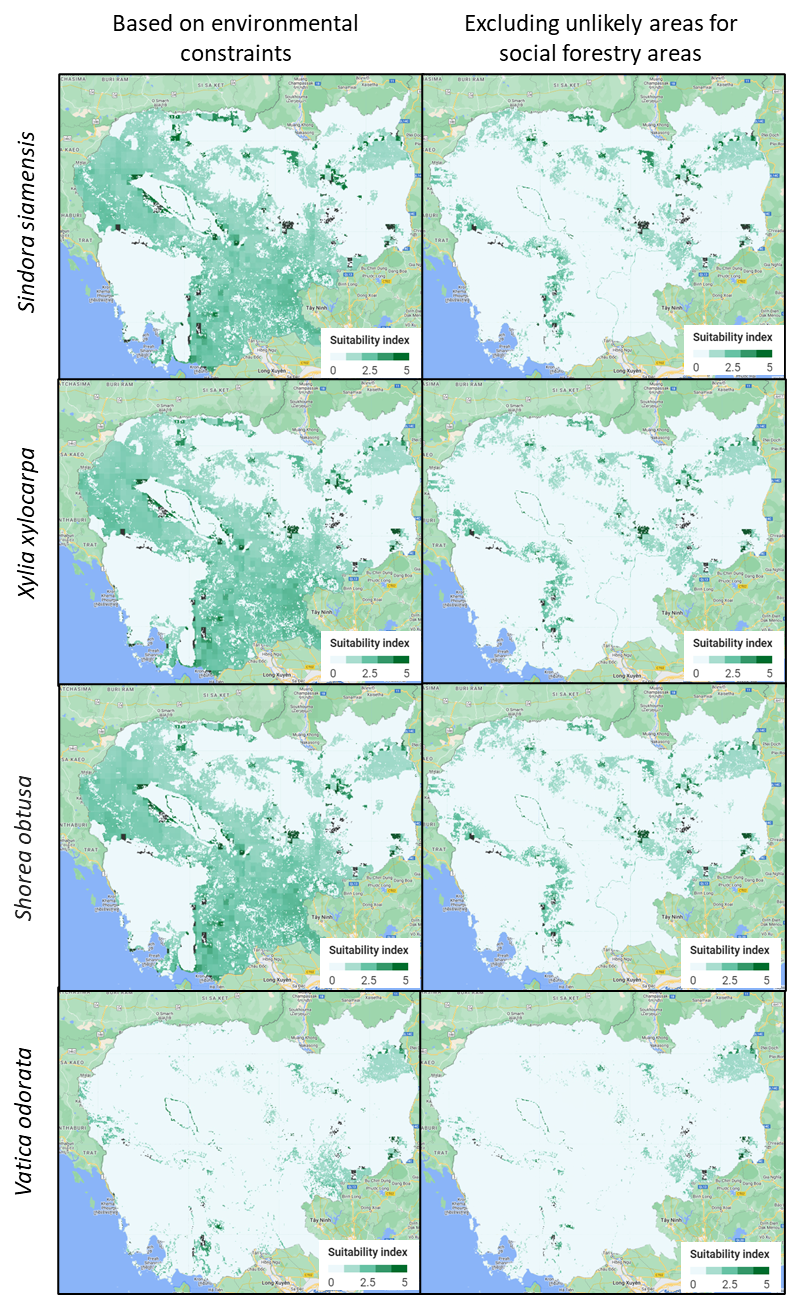
Figure 3b-1. Aggregate area of each of five se.plan index scores for Sindora siamensis in Cambodia. Note: In this and all subsequent histograms, “Count” is equivalent to square kilometers since final outputs of se.plan are at a 1 sq. km resolution.
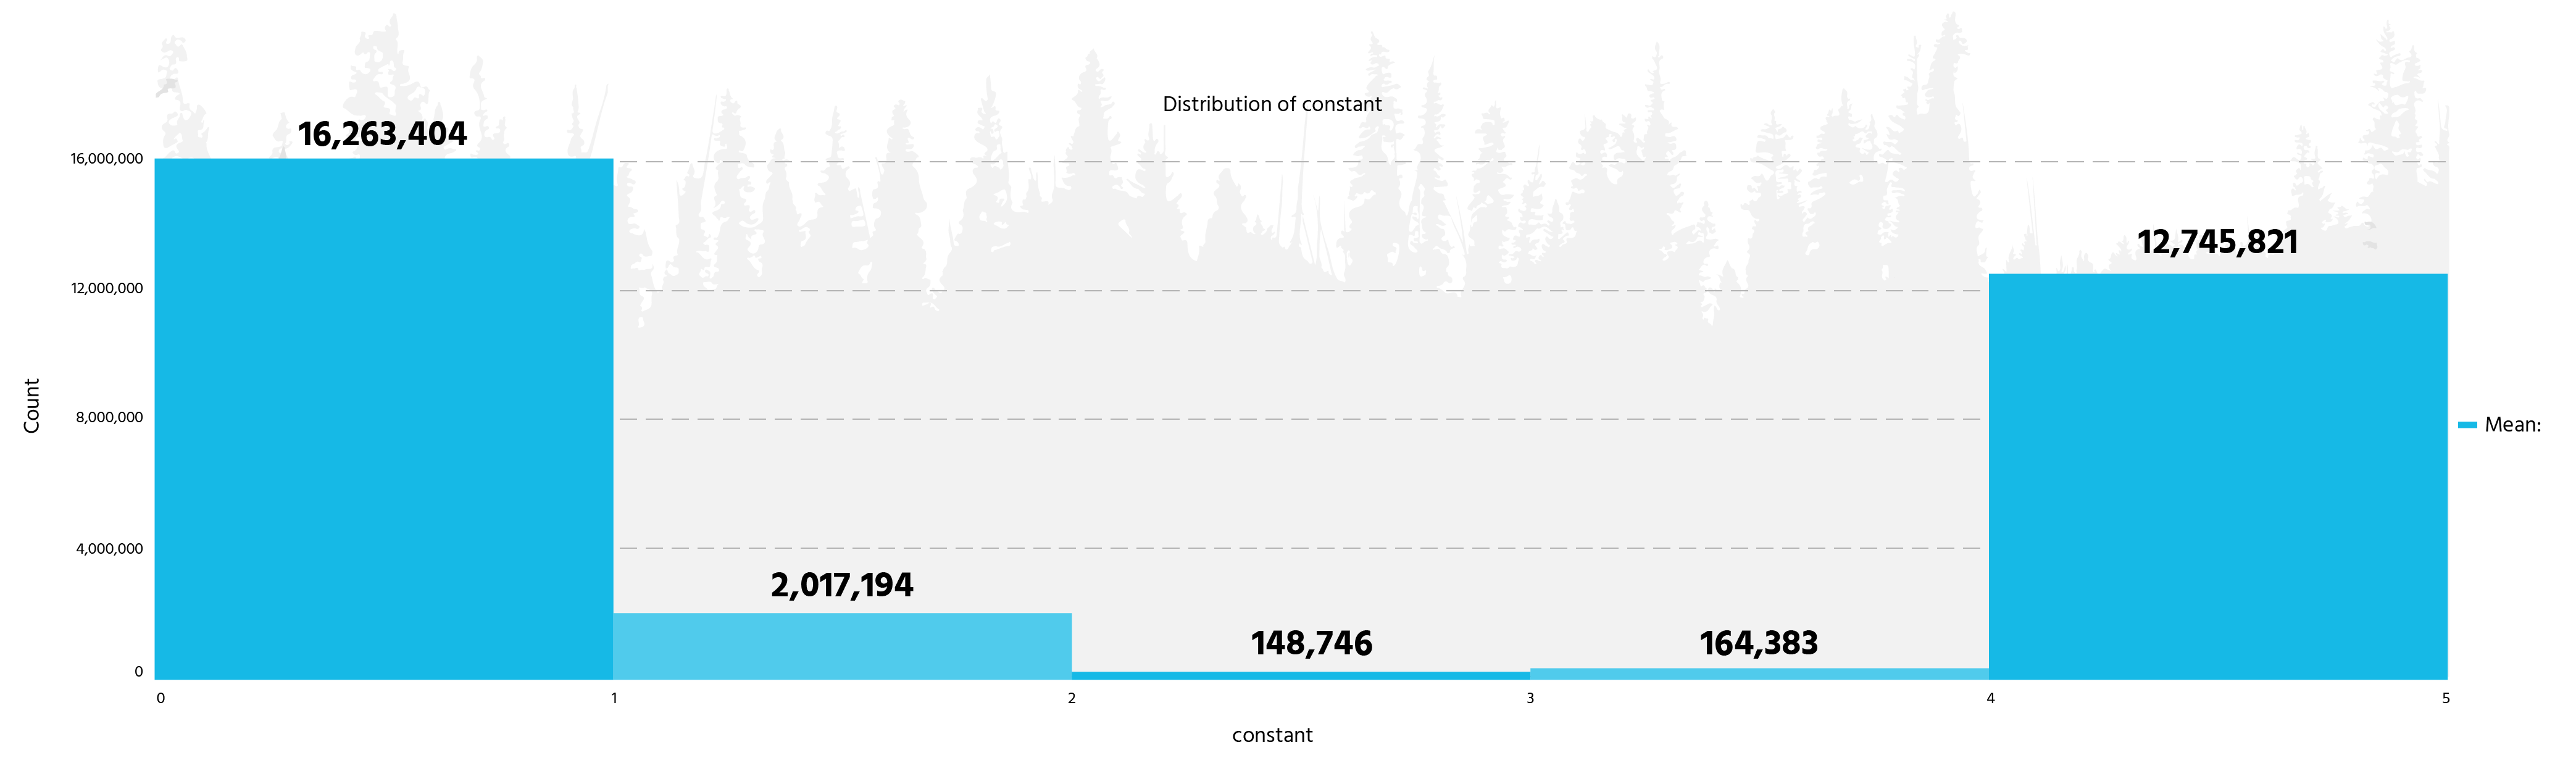
Figure 3b-2. Aggregate area of each of five se.plan index scores for Xylia xylocarpa in Cambodia.
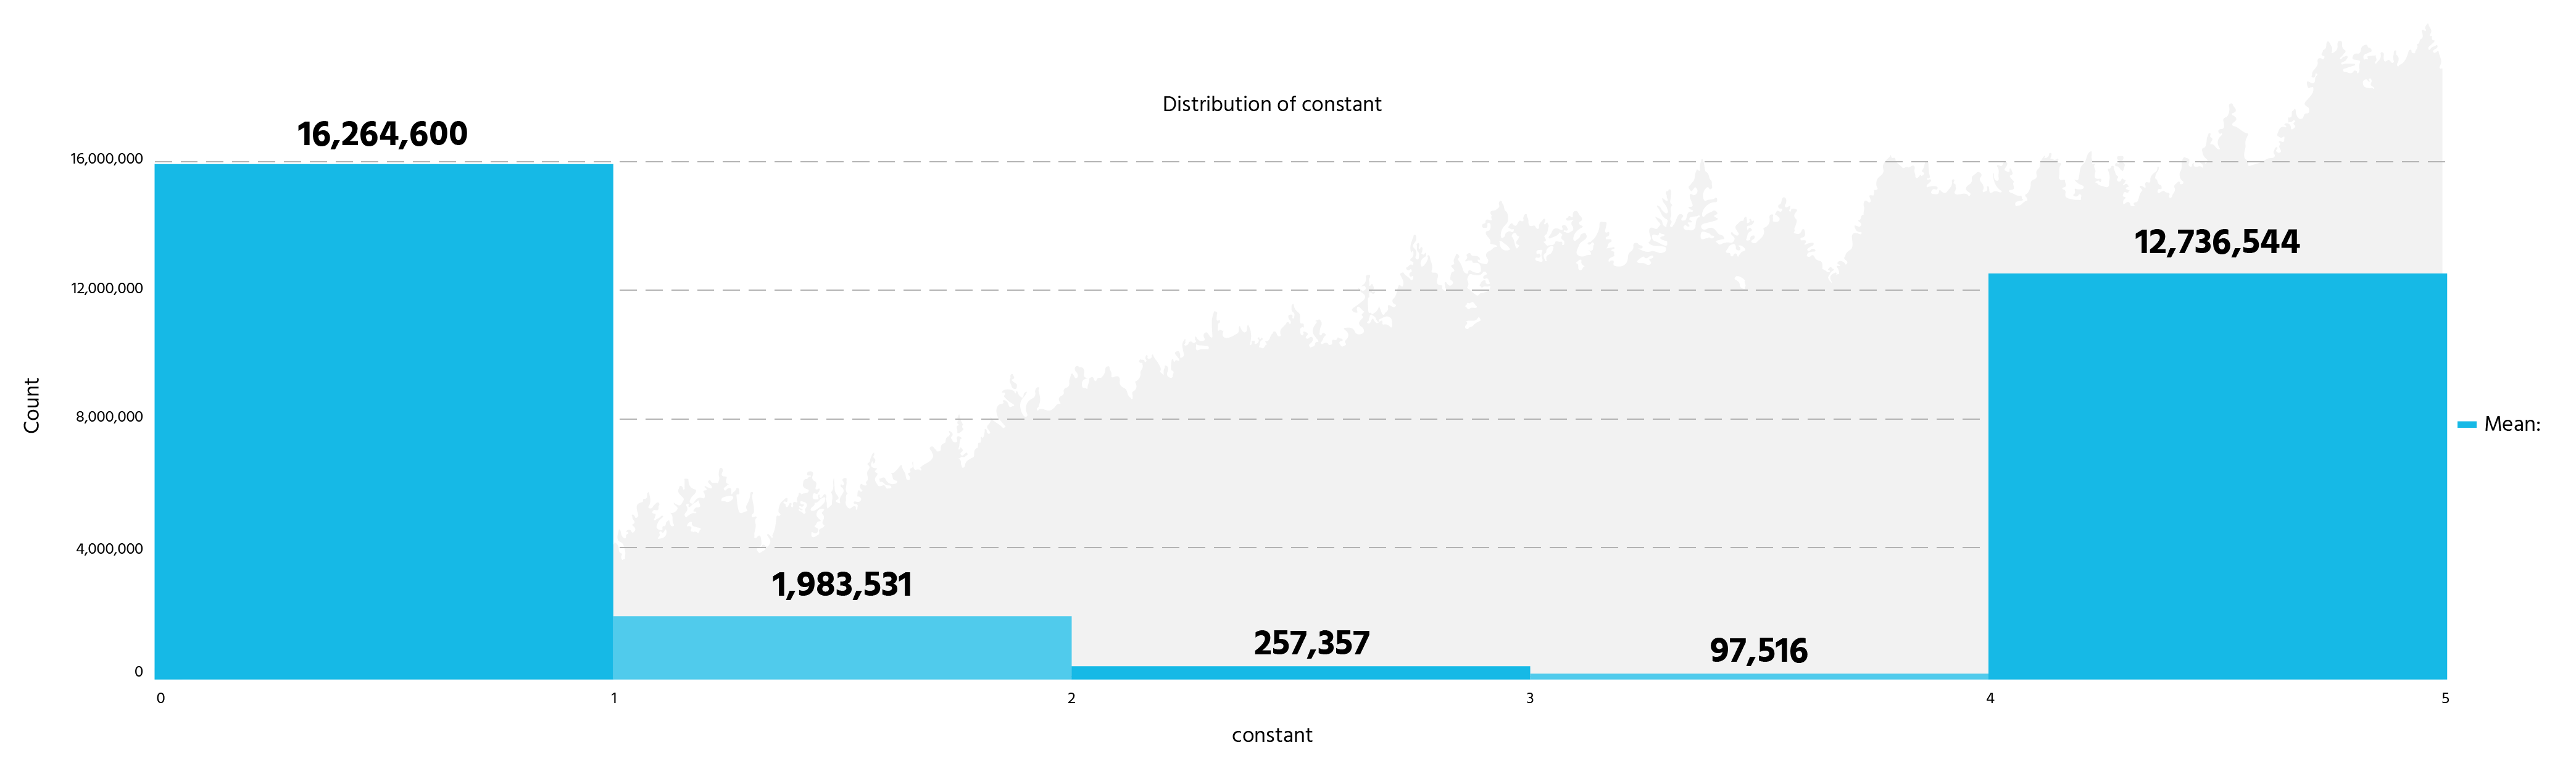
Figure 3b-3. Aggregate area of each of five se.plan index scores for Shorea obtusa in Cambodia.
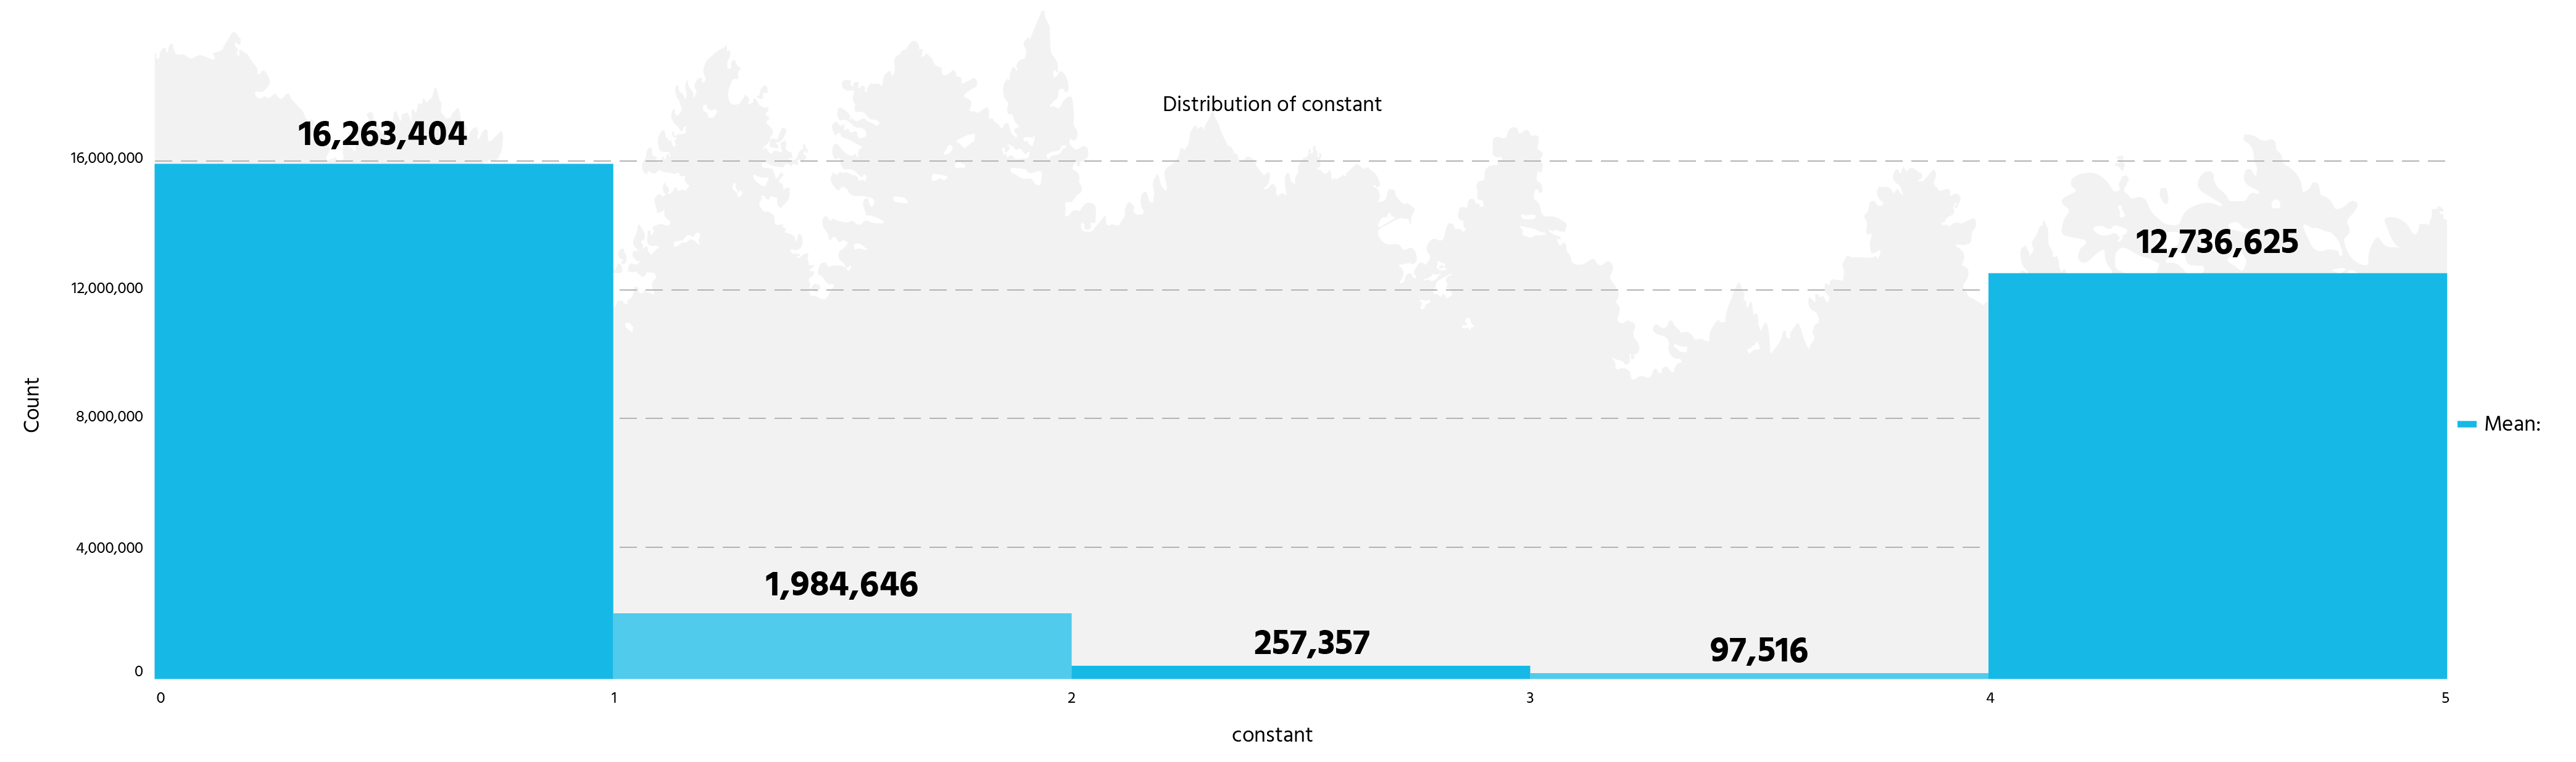
Figure 3b-4. Aggregate area of each of five se.plan index scores for Vatica odorata in Cambodia.
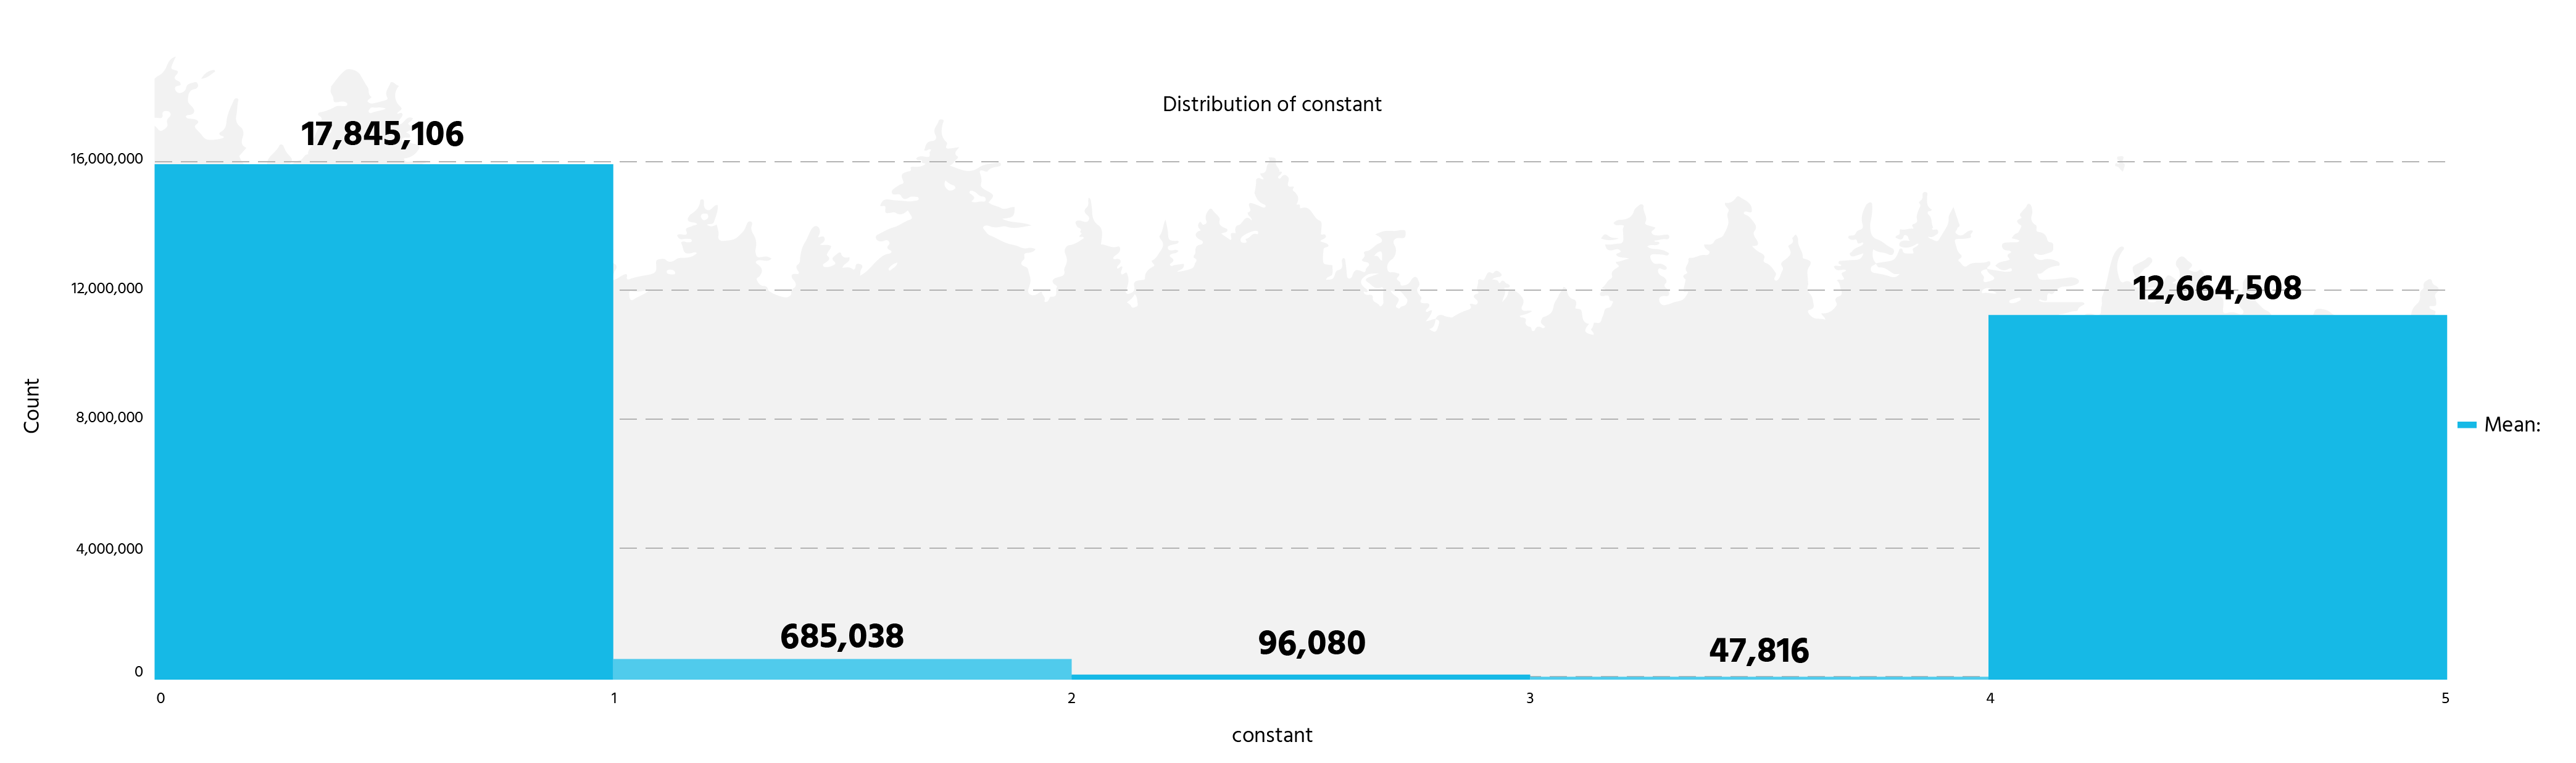
Figure 3c. Intersection of priority areas (se.plan indices 4 or 5) of four focal commodity species in Cambodia.
LAOS:
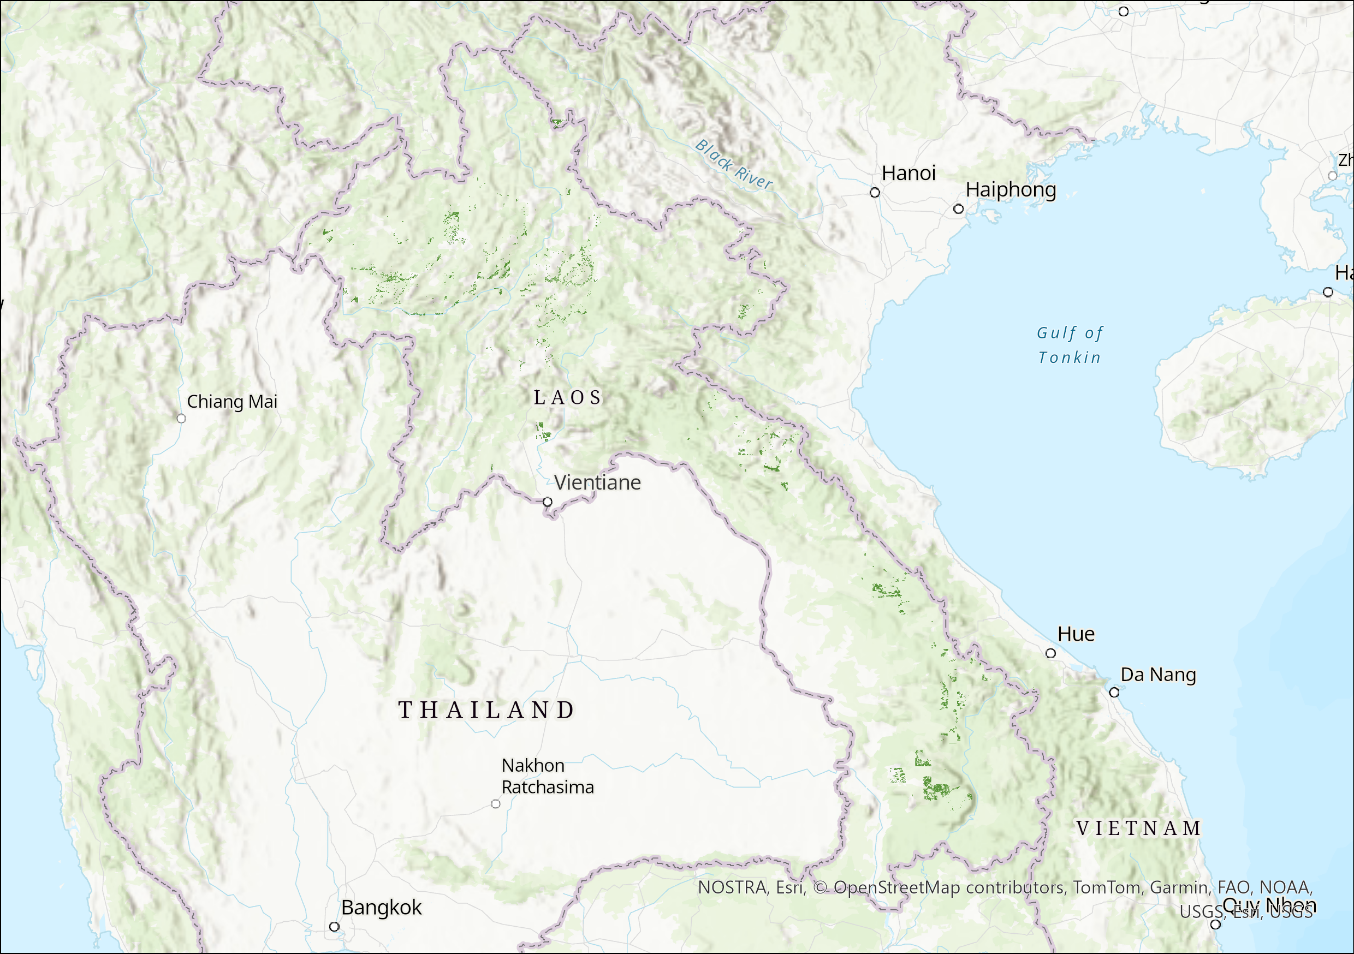
SE.PLAN results for Tectona grandis and Cratoxylum formosum were influenced by topographical features, with variability driven largely by elevation and aspect. Suitability for these species overlapped in areas where communities are within 5km of forests and have preferred elevation ranges.
Figure 4a. se.plan map outputs for focal commodity species in Lao PDR.
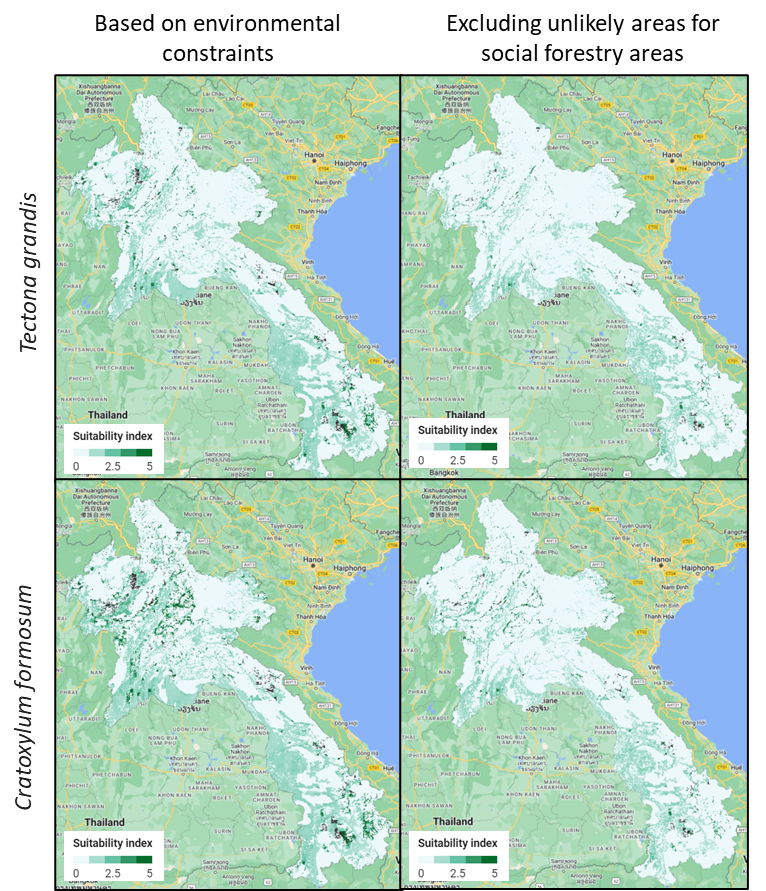
Figure 4b-1. Aggregate area of each of five se.plan index scores for Tectona grandis in Laos.
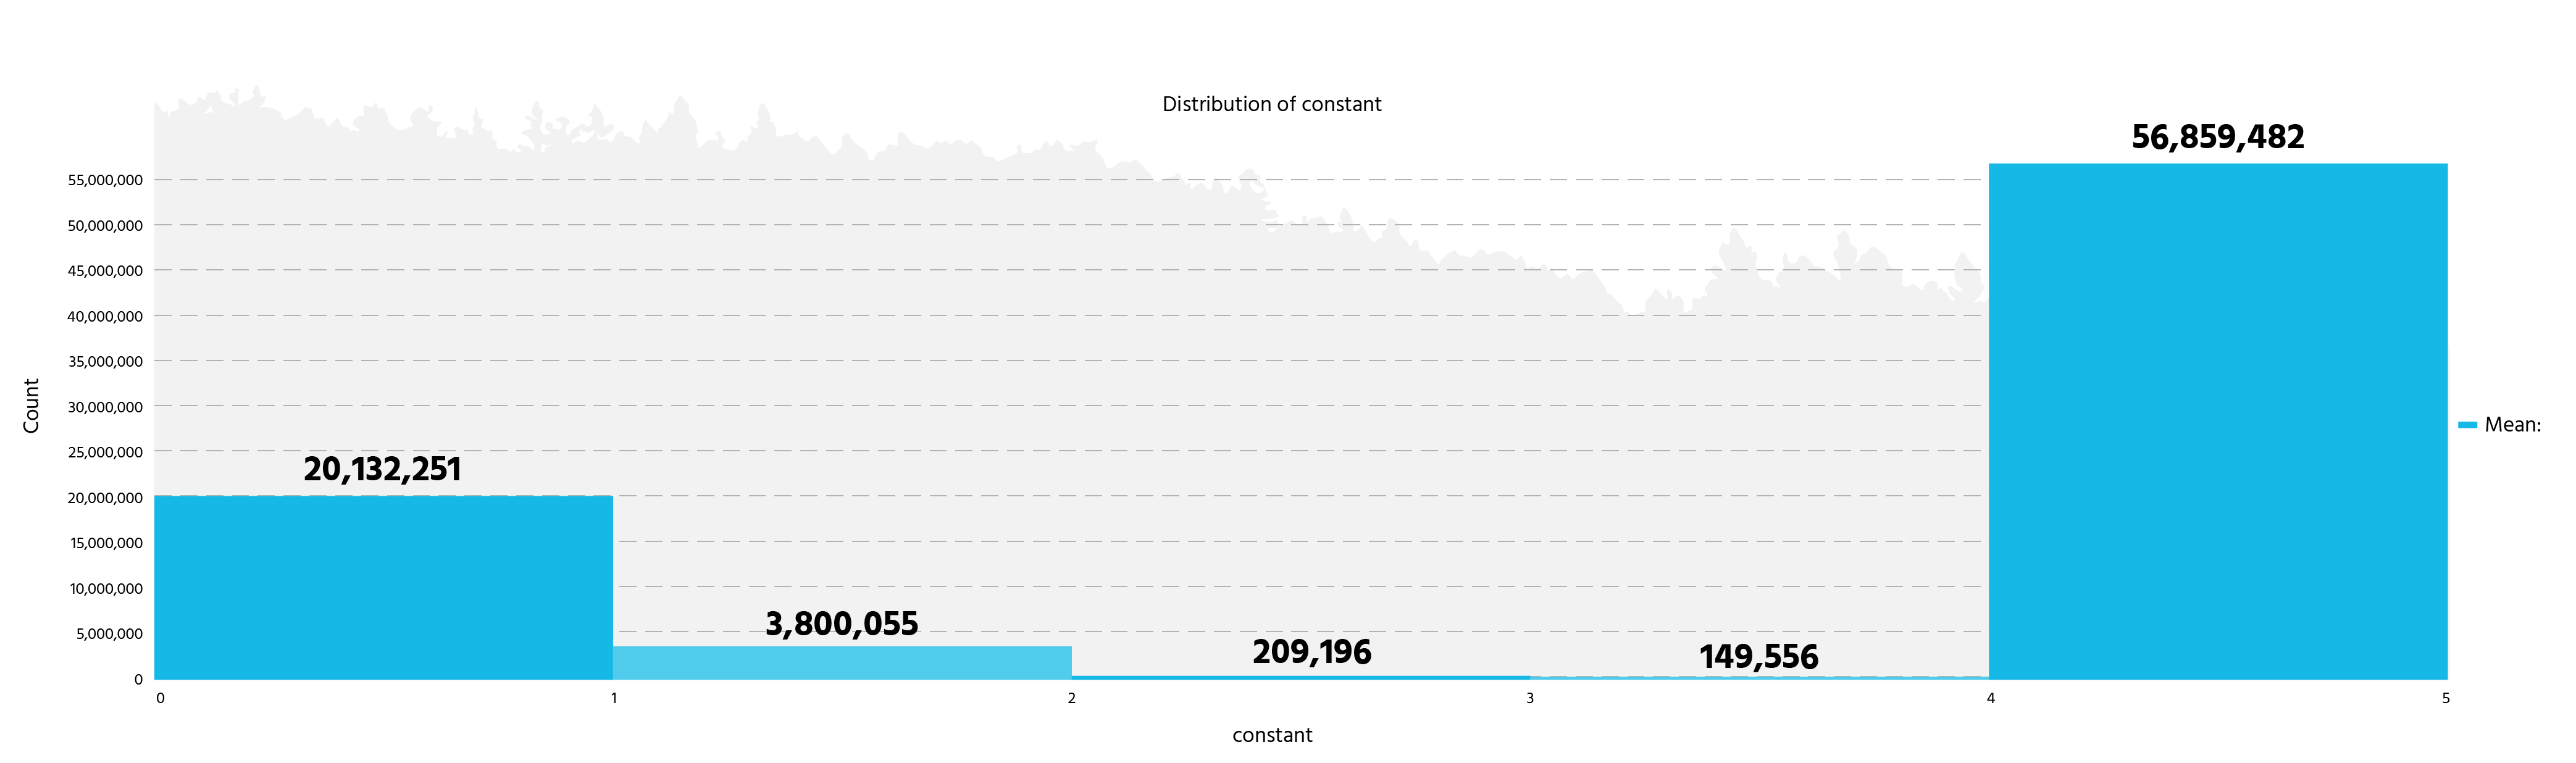
Figure 4b-2. Aggregate area of each of five se.plan index scores for Cratoxylum formosum in Laos.
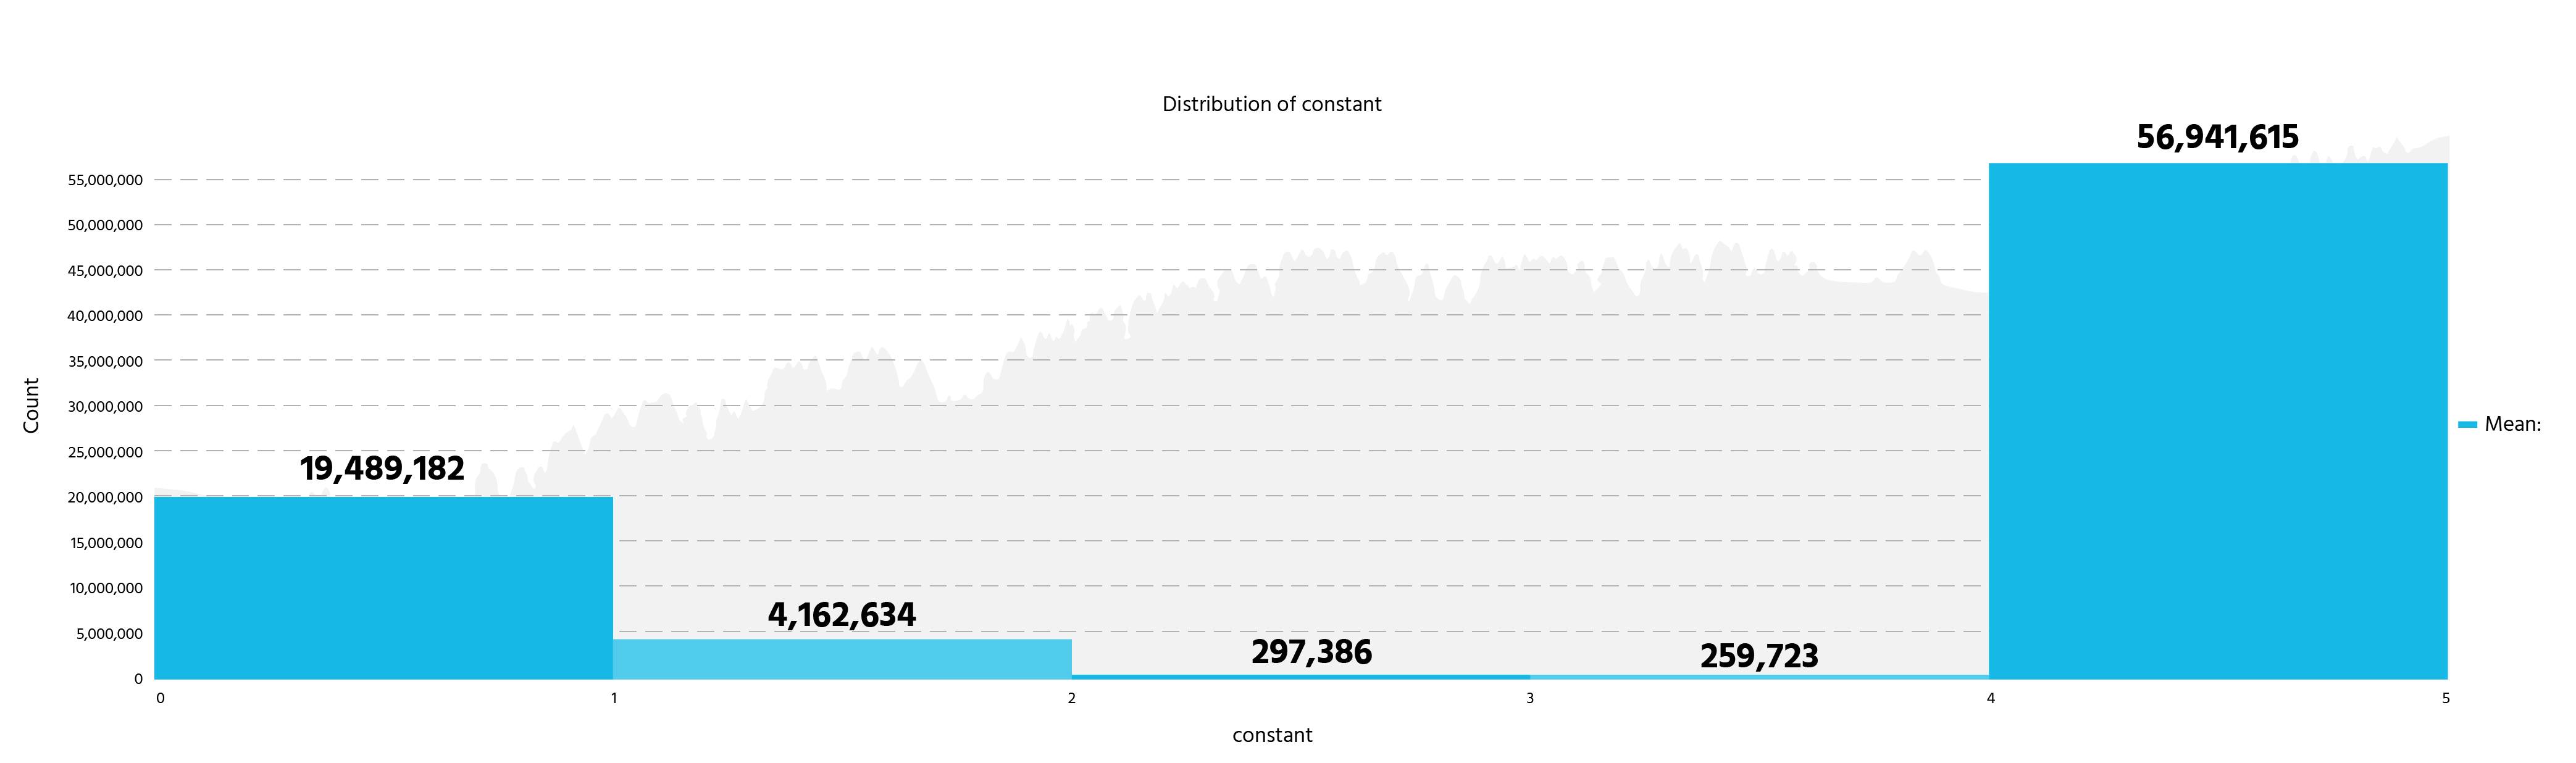
Figure 4c. Intersection of priority areas (se.plan indices 4 or 5) of two focal commodity species in Laos.
INDONESIA:
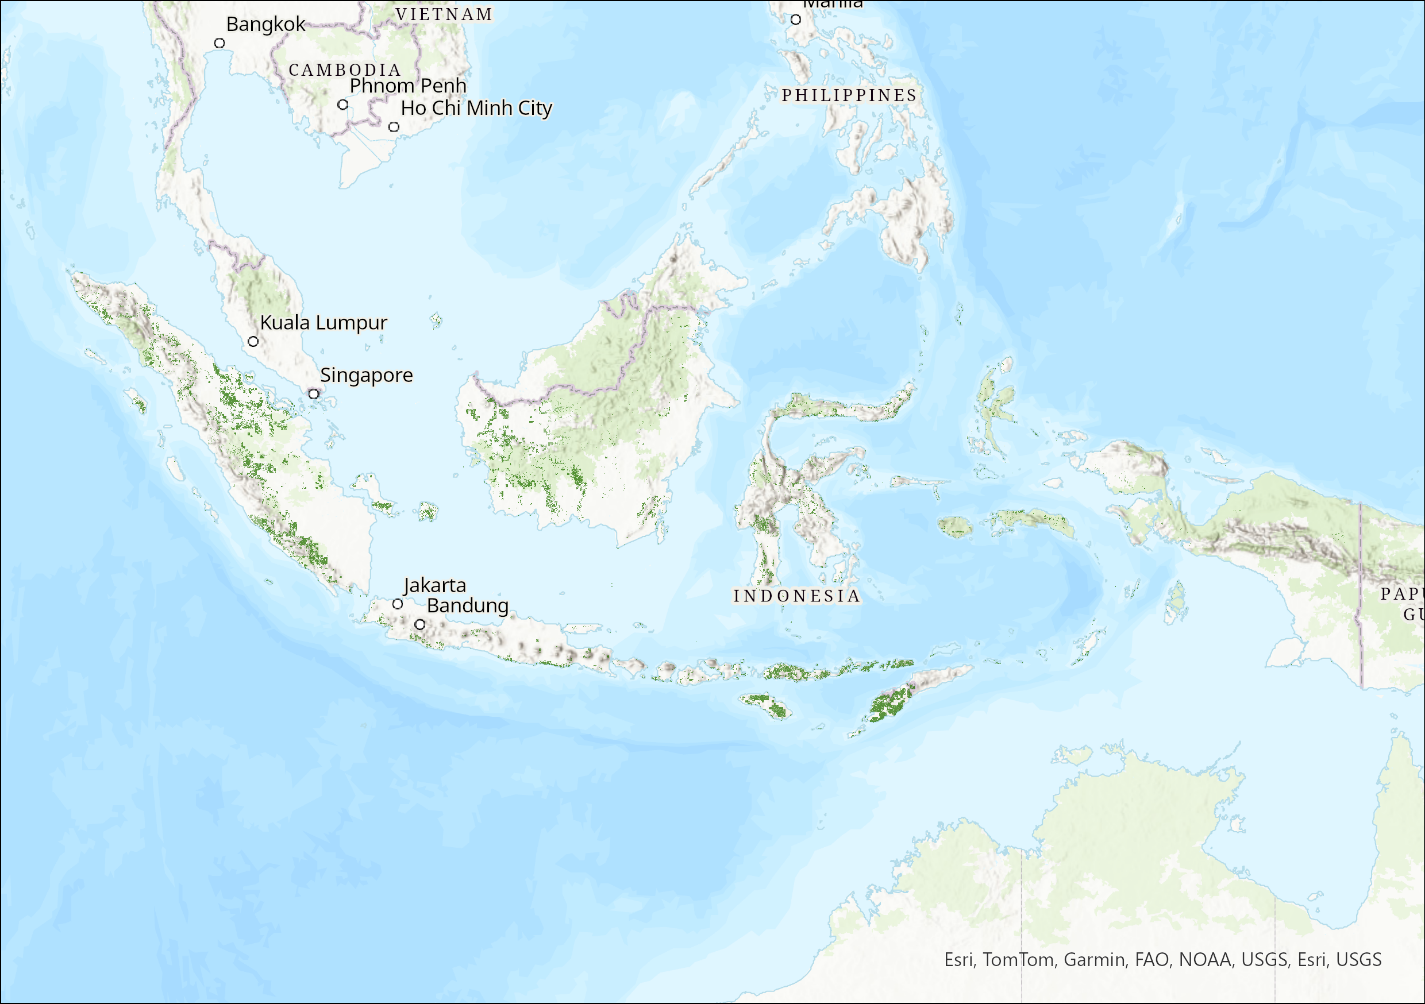
Priority area maps for two species in Indonesia show similarities, with Tectona grandis having less suitable areas due to sensitivity to higher slopes.
(Refer to Figures 3a, 3b-1 to 3b-4 for Cambodia, Figures 4a, 4b-1 to 4b-2 for Laos, and Figures 5a, 5b-1 to 5b-2 for Indonesia for visual representations of SE.PLAN results.)
Figure 5a. se.plan map outputs for focal commodity species in Indonesia.
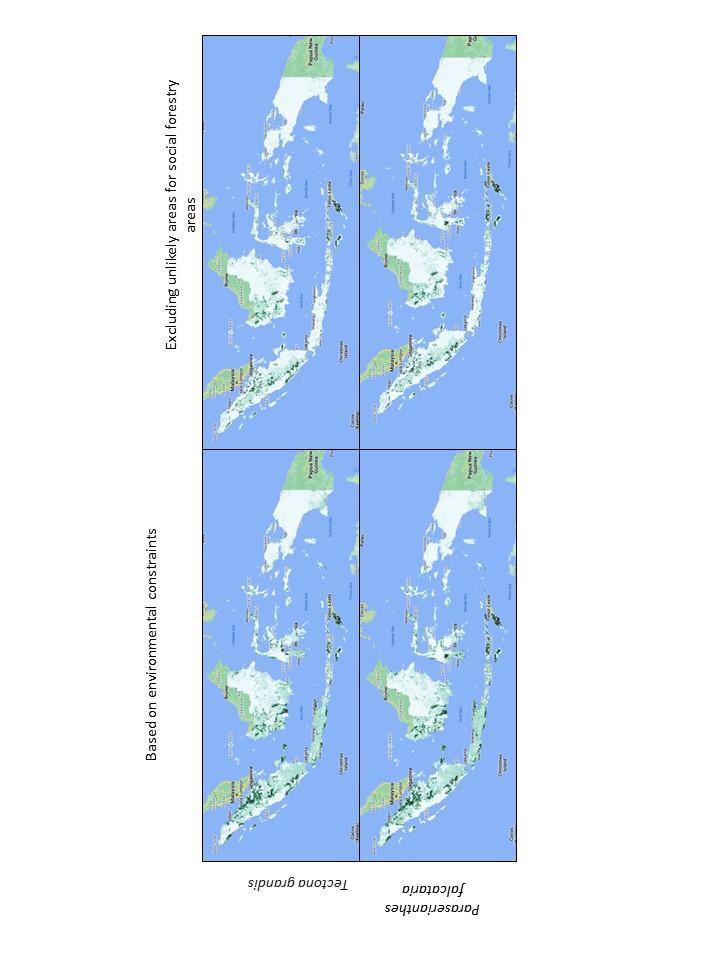
Figure 5b-1. Aggregate area of each of five se.plan index scores for Tectona grandis in Indonesia.
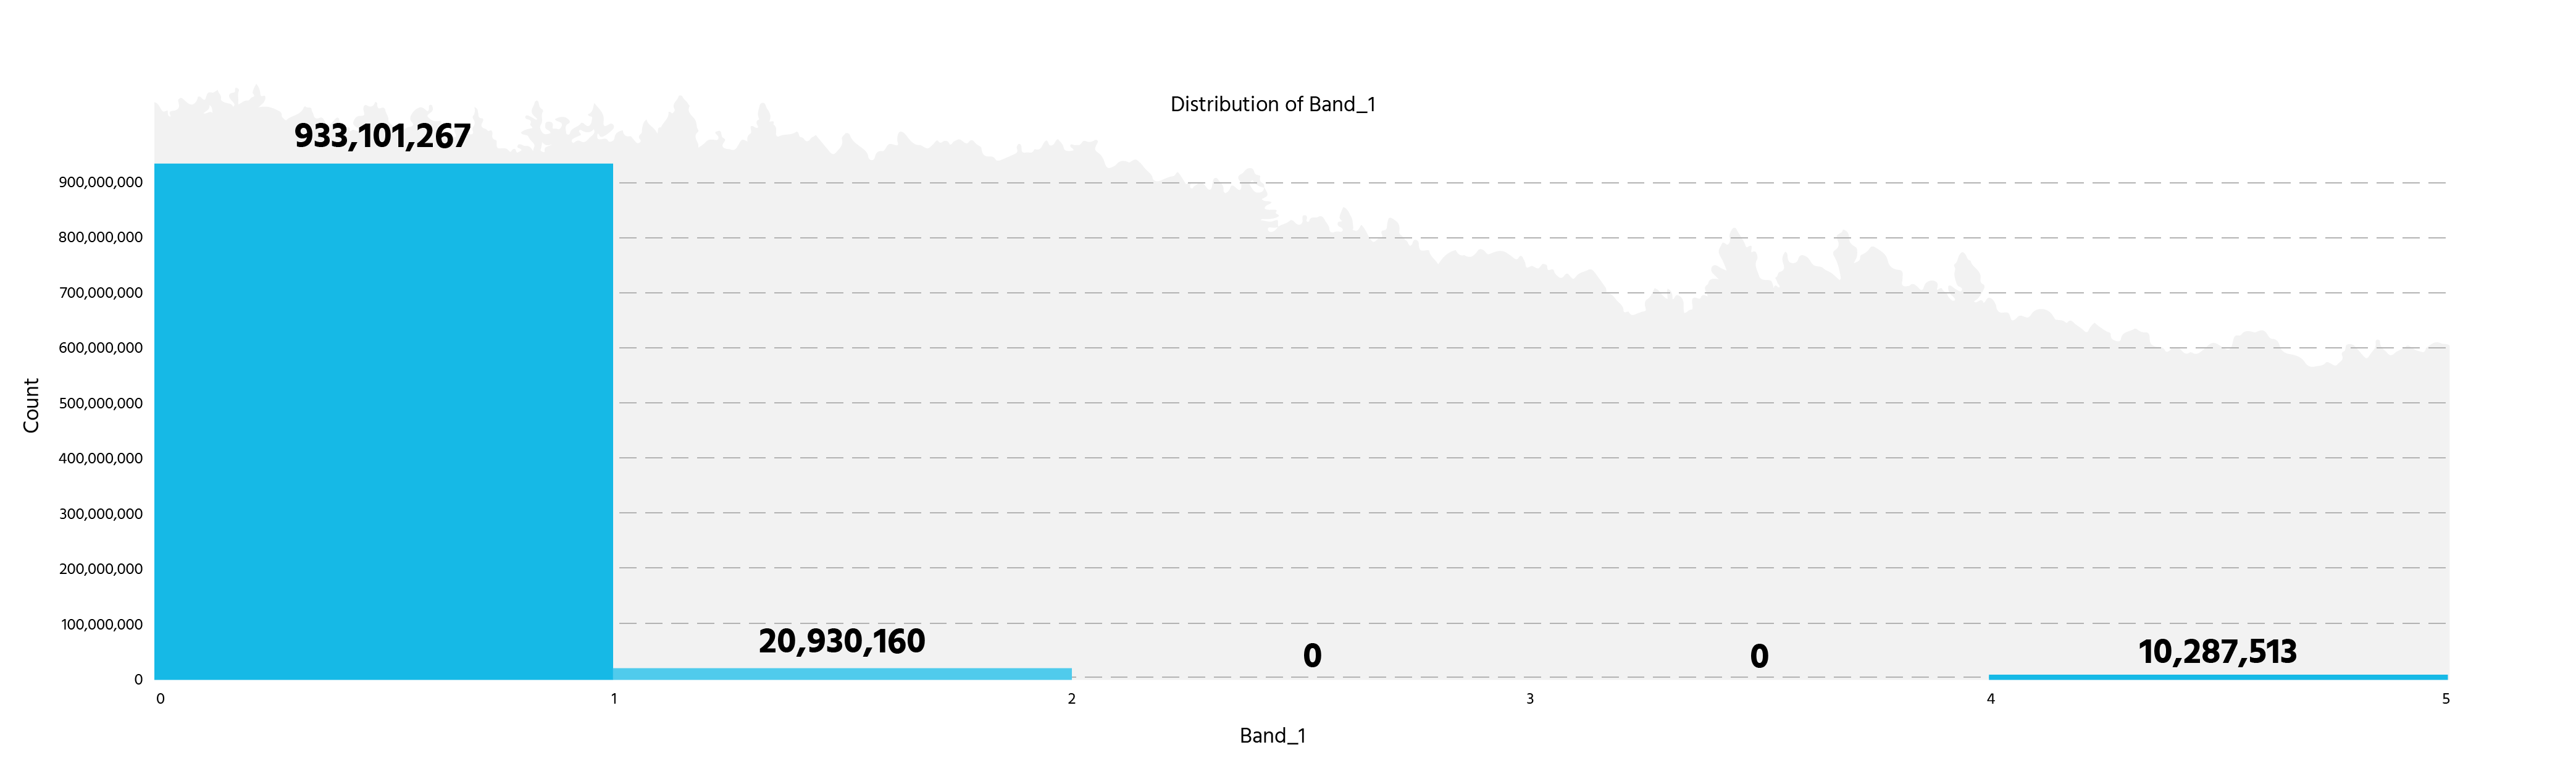
Figure 5b-2 Aggregate area of each of five se.plan index scores for Peraserianthes falcataria in Indonesia.
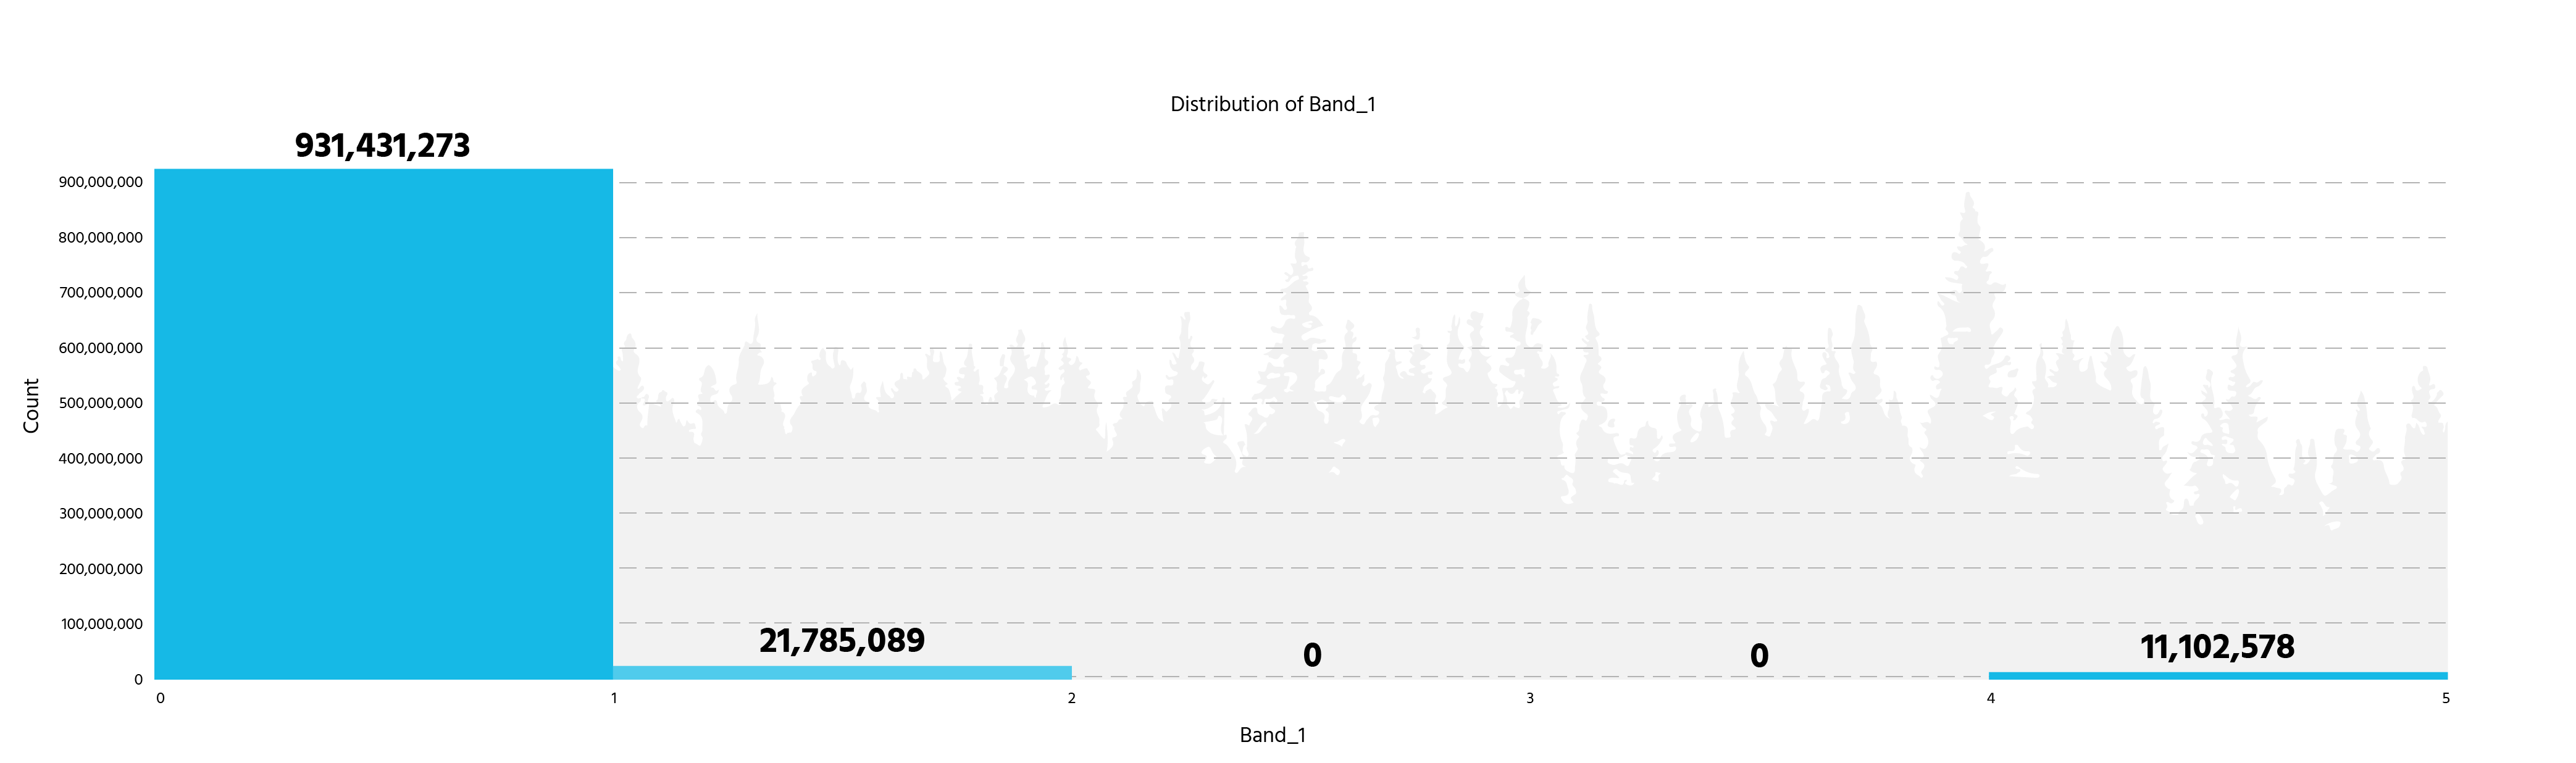
Figure 5c. Intersection of priority areas (se.plan indices 4 or 5) of two focal commodity species in Laos.
Conclusion
Our analysis provides insight into the potential for investment into the focal commodity species and associated value chains in a social forestry context.
In Cambodia, the evaluation highlighted significant potential north of the Cardamom Mountain region, areas north of the Tonle Sap, and in Ratanakiri province. The results in Laos displayed shared suitability across species, with variations primarily driven by slope preferences. In Indonesia, the distinct sensitivity of Tectona grandis to slopes stood out, impacting its suitability compared to other species. Despite these differences, the analysis consistently emphasized the significance of factors like forest proximity to communities, elevation, and forest fragmentation in determining suitability across these regions.
These maps are a significant step in prioritizing areas in these countries where investment, coupled with careful land use planning and the right supporting policies, can help secure economic benefits for communities and restoration of trees—likely with ecosystem conservation and climate change mitigation and adaptation benefits.
By: UN-REDD Programme

